CPET Test Interpretation, Part 4: Interpretation and Summary

After having gone through the descriptive checklists for ventilatory, gas exchange and circulatory limitations the reason(s) for a patient’s exercise limitation, if any, should be reasonably clear. However, one of the first questions that should be asked when reading an exercise test is what was the purpose of the test?

  • Maximum safe exercise capacity for Pulmonary Rehab?
  • Rule in/rule out exercise-induced bronchospasm?
  • Pre-operative assessment?
  • Dyspnea of uncertain etiology?
  • What is the primary limitation to exercise (pulmonary or cardiac)?
  • Is deconditioning suspected?

The interpretation and summary should address these concerns.

The descriptions checklist is the main groundwork for the actual interpretation and any abnormal findings there may signal the need for specific comments. The interpretation should start by indicating whether or not the patient’s exercise capacity was normal and then should indicate the presence or absence of any limitations.

What was the patient’s maximum exercise capacity (maximum VO2)?

  • >120% = Elevated
  • 80% to 120% = Normal
  • 60% to 79% = Mildly reduced
  • 40% to 59% = Moderately reduced
  • <40% = Severely reduced

Example: There was a {elevated | normal | mildly reduced | moderately reduced | severely reduced} exercise capacity as indicated by the maximum oxygen consumption of XX%.

Continue reading
CPET Test Interpretation, Part 3: Circulation

I would like to re-emphasize the importance of the descriptive part of CPET interpretation. At the very least consider it to be a checklist that should always be reviewed even when you think you know what the final interpretation is going to be.

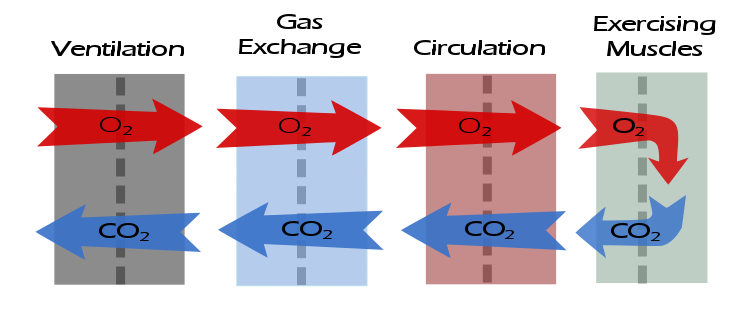
After gas exchange, the next step in the flow of gases is circulation. The descriptive elements for assessing circulation are:

What was the maximum heart rate?

The maximum predicted heart rate is calculated from 220 – age.

A maximum heart rate above 85% of predicted indicates that there has been an adequate exercise test effort.

Example: The maximum heart rate was XX% of predicted {which indicates an adequate test effort}.

What was the heart rate reserve?

The heart rate reserve is (predicted heart rate – maximum heart rate). A heart rate reserve that is greater than 20% of the (predicted heart rate – resting heart rate) is elevated and may be an indication of either chronotropic incompetence or an inadequate test effort.

Note: A negative heart rate reserve will occur whenever a patient exceeds their predicted heart rate.

Example: The heart rate reserve is XX BPM which is {within normal limits | elevated}.

Continue reading

CPET Test Interpretation, Part 2: Gas Exchange

I would like to re-iterate the importance of the descriptive part of CPET interpretation. At the very least consider it to be a checklist that should always be reviewed even when you think you know what the final interpretation is going to be.

After ventilation, the next step in the flow of gases is gas exchange. The descriptive elements for assessing gas exchange are:

What was the maximum oxygen consumption (VO2)?

The maximum oxygen consumption is the prime indicator of exercise capacity. Predicted values should be based on patient height, age, weight and gender.

Note: There is actually a surprising limited number of reference equations for maximum VO2. The only one I’ve found that takes weight into consideration in a realistic manner is Wasserman’s algorithm. Some test systems do not offer this reference equation but I feel it is worthwhile for it to be calculated and used regardless. See appendix for the algorithm.

Note: The maximum VO2 does not necessarily occur at peak exercise (i.e. test termination). This can happen in various types of cardiac and vascular diseases but also because the patient may decrease the level of their exercise before the test is terminated.

  • Maximum VO2 > 120% of predicted = Elevated
  • Maximum VO2 = 80% to 119% of predicted = Normal
  • Maximum VO2 = 60% to 79% of predicted = Mild impairment
  • Maximum VO2 = 40% to 59% of predicted = Moderate impairment
  • Maximum VO2 < 40% of predicted = Severe impairment

Example: The maximum VO2 was X.XX LPM { which is {mildly | moderately | severely } decreased | within normal limits | elevated}.

Continue reading

N2 washout is affected by N2 excretion and other factors

The Lung Clearance Index (LCI) was first described in 1952 by Margaret Becklake, and is defined as the number of lung volume turnovers required to reduce the concentration of a tracer gas by a factor of 40. LCI is calculated as the cumulative exhaled volume (CEV) during the washout divided by the functional residual capacity (FRC).

Clinically LCI has been used most often in individuals with cystic fibrosis and this is because the LCI has been repeatably shown to be sensitive to changes in airway status that are not reflected in the FEV1. LCI has shown similar results in patients with primary ciliary dyskinesia. As expected LCI has also been tested on patients with COPD, bronchiectasis and asthma although these patients tend to show a better correlation between FEV1 and LCI.

LCI has been performed using a wide variety of tracer gases including helium, methane, argon, nitrogen and sulfur hexaflouride (SF6). The commercial systems that are currently available use either N2 or SF6. N2 washout LCI has recently received a great deal of criticism and some of these criticisms seem to apply to N2 washout lung volumes as well.

Most specifically, a number of studies have noted that the N2 washout FRC is routinely higher than the SF6 FRC and plethysmographic FRC. In addition, the N2 washout LCI tends to be significantly higher than the SF6 LCI and this difference increases as LCI increases.

As examples in a study of patients with COPD the N2 washout FRC averaged 14% higher than the plethysmographic FRC. In other studies of normal subjects the N2 washout FRC was on average 0.20 to 0.21 L higher than plethysmographic FRC. Finally, a study that performed N2 and SF6 washouts simultaneously on CF patients and healthy controls showed the N2 washout LCI to be on average 7.93% higher than SF6 in the healthy controls and 29.13% higher than SF6 in the CF patients. In the same study N2 washout FRC was 12.66% higher than SF6 FRC in the healthy controls and 30.09% higher than SF6 FRC in CF patients.

So why is there such a discrepancy?

Continue reading

Oscillometry

A month or two ago in the AARC Diagnostics forum several members noted that their labs had acquired Impulse Oscillometry systems a number of years ago but that their physicians had since stopped ordering oscillometry tests, mostly because nobody understood what it was measuring and didn’t know how to interpret the results. There are a number of reasons why this is probably not an uncommon scenario and why, despite being first described in 1956, oscillometry is not used more widely.

But first, what is oscillometry, and what’s the best way to understand it?

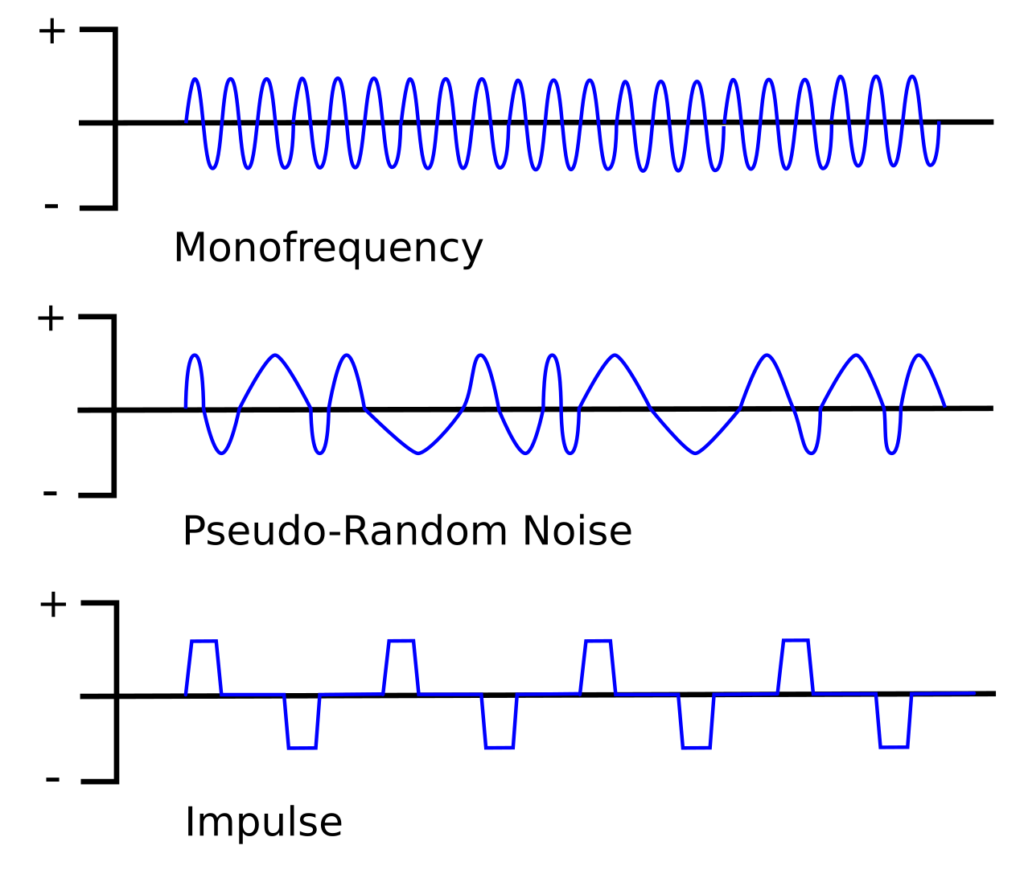
Oscillometry refers to a closely related group of techniques for measuring respiratory impedance by superimposing small pressure waves on top of normal tidal breathing.

There are three main approaches: the Forced Oscillation Technique (FOT), which is sometimes used a blanket term for all oscillometry techniques but more often refers to a single frequency technique, Impulse Oscillometry (IOS) and Pseudo-Random Noise (PRN). Most commercial oscillometry systems use either PRN or IOS because each approach uses multiple oscillation frequencies more or less simultaneously which allows testing to performed relatively quickly. The mono-frequency technique is used mostly in research because although it is slow to scan all frequencies, it is able to resolve rapid changes occurring at a single frequency.

All techniques share a similar equipment configuration:

The oscillatory pressure is usually generated by a loudspeaker, although the actual waveform and the frequency it produces differ for each technique. The peak pressures are usually on the order of +/- 1 to 5 cm H2O (+/- 0.1 to 0.5 kPa). Because patients have to breathe during testing, the system provides a steady flow of fresh air in one manner or another but this has to include a low pass filter of some kind so that the pressure waveform is not significantly diverted or blunted. The key measurements are flow and the pressure at the mouth.
Continue reading

The dual tracer gas single-breath washout (DTG-SBW) and ventilation inhomogeneity

I’ve been interested in ventilation inhomogeneity for a while and as ways to measure it I have looked at VA/TLC ratios, the Lung Clearance Index (LCI) and the phase III slope of the single-breath N2 washout (SIIIN2). All of these tests are able to provide some information about ventilation inhomogeneity but each has their own limitations and just as importantly although their results have a relatively clear relationship with ventilation inhomogeneity it’s not quite as clear what exactly it is they are measuring. A friend recently pointed me to an on-line article in Chest that discusses the dual-tracer single-breath washout test in patients with COPD. The apparent advantage of this test is that it is able to provide information about the site of the ventilation inhomogeneity. Although dual tracer gases have been used to study airway function for over 50 years the limitation of this technique has been the need to use a mass spectrometer. Some recent advances in technology have made it possible for this type of testing to be performed with a significantly less expensive gas analyzer and this has revived an interest in the dual-tracer gas single-breath washout (DTG-SBW).

The two tracer gases in question are Helium and Sulfur Hexaflouride (SF6). Helium has a density of 4 gm/mol and the density of SF6 is 146 gm/mol, and it is the difference in densities between these two inert and insoluble gases that make this test useful. In order to understand why we need to revisit to the anatomy of the terminal airways.

From Osborne S. Airway resistance and airflow through the tracheobronchial tree. www.SallyOsborne.com.

From Osborne S. Airway resistance and airflow through the tracheobronchial tree. www.SallyOsborne.com.

Continue reading

Shunt fraction

I was reading an article recently that made an off-hand reference to the 100% oxygen shunt fraction test. Results from the test were included in the data analysis but the equations the researchers used were not presented nor were they referenced, nor was the procedure described. This is probably because the shunt fraction test and its equations are very much old-school pulmonary physiology but even if the subject is probably covered at one time or another in physiology classes I suspect that some of the issues involved in the calculation are not as well understood as they should be.

Shunt_Model_1

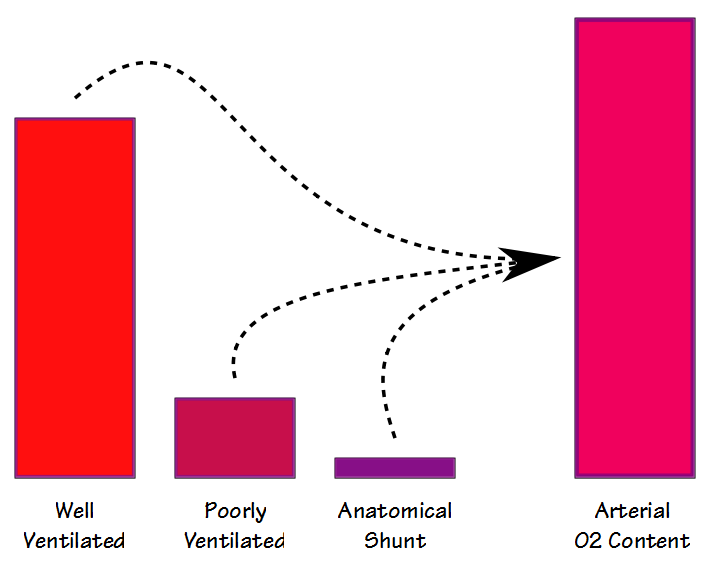
There are some similarities between the deadspace-tidal volume ratio (Vd/Vt) and the shunt fraction but even though they are both are involved in gas exchange (and to some extent they also correlate with each other) they are measuring different things. When blood flows through the lung some blood passes through well ventilated alveoli and becomes fully saturated; some blood passes through poorly ventilated alveoli and is only partially saturated; and some bypasses the alveoli entirely. The resulting arterial oxygen content is the summed average of all of these compartments.

Summing

There are two different ways that shunt fraction can be measured and calculated; physiological and anatomical. The physiological shunt equation can be performed at any FiO2 (but usually around the FiO2 of room air) and requires that arterial and mixed venous blood samples be taken more or less simultaneously and then analyzed for PO2 and SaO2. The basic formula is:

Continue reading

Anatomic dead space

I’d spent some time researching single-breath tests a while back and of course ran across the Fowler method for measuring anatomic dead space. It’s a relatively simple test but assessing its results as well as the results of alternate dead space measurement techniques turns out to be more complicated than I had remembered.

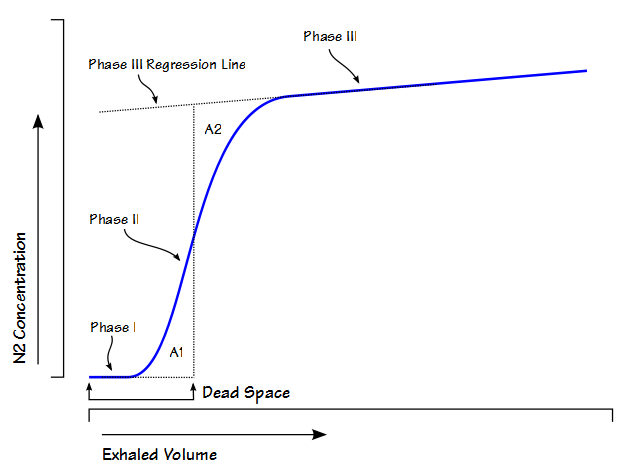
The official definition of anatomic dead space is that it is that part of the inhaled volume that remains in the airways at the end of inhalation and does not participate in gas exchange. An accurate estimate of this volume is important because respiratory dead space (Vd/Vt, discussed previously) is composed of both anatomical and physiological dead space. The physiological component of the respiratory dead space cannot be determined without knowing the anatomical dead space.

Anatomic dead space is usually considered to be the physical volume of the airways but static measurements of airway volume do not take into consideration the dynamic aspects of respiration. The most commonly used method for measuring anatomic dead space in a research setting is the single-breath technique developed by Fowler in 1948. In this method, after an inhalation of oxygen, the nitrogen concentration in an individual’s exhalation is plotted against exhaled volume.

Fowler Dead Space

Continue reading

DLNO isn’t the same as DMCO but sometimes it’s useful to pretend it (almost) is

Oxygen transport between the lungs and the body depends on numerous complex factors. Ventilation and the alveolar-capillary surface area are of course important but a critical component is hemoglobin. Oxygen is poorly soluble in water (which is what blood is mostly made of) and the transportation of oxygen throughout the body would not happen without hemoglobin’s ability to absorb and release oxygen on demand. Although it is possible to measure the diffusing capacity of oxygen (DLO2) the process is technically difficult and not at all suited to routine clinical testing.

There are a number of gases that are able to diffuse across the alveolar-capillary membrane and can be used in a variety of physiological measurements but in order for a particular gas to act as a substitute for oxygen it must be able to interact with hemoglobin. Carbon monoxide (CO) has an affinity for hemoglobin approximately 220 times greater than oxygen and was the first gas used to measure diffusing capacity (DLCO). DLCO has been a routine test for well over 50 years and has been measured by single-breath, steady-state and rebreathing techniques.

Nitric Oxide (NO) has an affinity for hemoglobin about 400 times greater than carbon monoxide (it is generally an irreversible process since the end product is methemoglobin whereas hemoglobin’s binding with CO is more reversible) and for this reason it can also be used to measure diffusing capacity. DLNO can also be measured by single-breath, steady-state and rebreathing techniques. Because of its high affinity and the speed at which the binding of NO to hemoglobin occurs numerous researchers have assumed that DLNO is equivalent to DMNO (the membrane component of diffusing capacity). This is not really true, but it can be a useful fiction and in order to understand why it’s necessary to look at the basic physiology of diffusing capacity tests.

Roughton and Forster’s seminal 1957 paper showed that diffusion is the sum of two resistances. I’ve discussed this previously but specifically:

1_over_DLCO_formula

Where:

DMCO = membrane component

θCO = the rate at which CO binds to hemoglobin

Vc = pulmonary capillary blood volume

The first resistance (1/DMCO) is the resistance to the diffusion of CO through the alveolar-capillary membrane and blood plasma to the surface of the stagnant plasma boundary layer around a red blood cell. The second resistance refers to the diffusion rate of CO through the plasma boundary layer, then the wall and interior of the red blood cell and finally the rate of reaction with hemoglobin.

DL_Resistances Continue reading

Alveolar O2 and Altitude

Recently I was trying to explain the effect of altitude on blood oxygenation to somebody with IPF. They had observed that their oxygen saturation was fairly normal at sea level but that they needed to use their supplemental O2 when they went up to 2000 feet and didn’t understand why such a low altitude made that much of a difference. I don’t think I did very well with the explanation since at the time I was limited to only text and I much prefer pulling out diagrams and waving my hands in the air.

The place to start is with the alveolar air equation.

Alveolar Air Equation 1

Where:

PAO2 = partial pressure of O2 in the alveoli

FiO2 = fractional concentration of O2

PB = barometric pressure

PH20 = partial pressure of water vapor in the alveoli

PaCO2 = partial pressure of CO2 in the arteries

RER = respiratory exchange ratio (VCO2/VO2)

When normal values are plugged into the alveolar air equation it looks like this:

Alveolar Air Equation 2

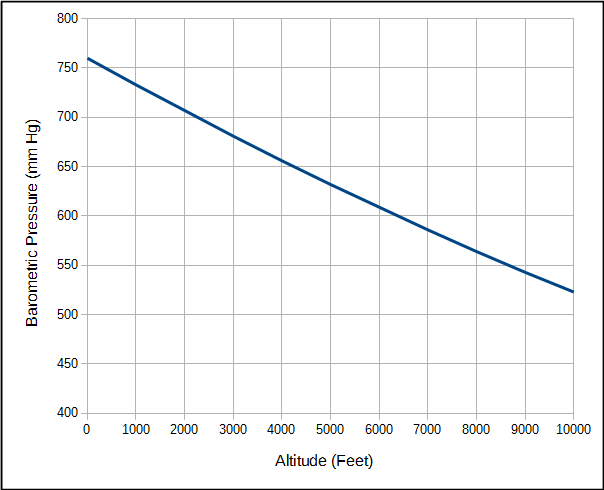
An important point is that when air is inhaled into the lung oxygen is diluted by the water vapor and carbon dioxide that are already there. The partial pressure of oxygen will vary with atmospheric pressure but the partial pressure of water vapor and carbon dioxide are relatively fixed values. Atmospheric pressure of course decreases with altitude.

BP_Altitude

Continue reading