The Lung Clearance Index (LCI) was first described in 1952 by Margaret Becklake, and is defined as the number of lung volume turnovers required to reduce the concentration of a tracer gas by a factor of 40. LCI is calculated as the cumulative exhaled volume (CEV) during the washout divided by the functional residual capacity (FRC).
Clinically LCI has been used most often in individuals with cystic fibrosis and this is because the LCI has been repeatably shown to be sensitive to changes in airway status that are not reflected in the FEV1. LCI has shown similar results in patients with primary ciliary dyskinesia. As expected LCI has also been tested on patients with COPD, bronchiectasis and asthma although these patients tend to show a better correlation between FEV1 and LCI.
LCI has been performed using a wide variety of tracer gases including helium, methane, argon, nitrogen and sulfur hexaflouride (SF6). The commercial systems that are currently available use either N2 or SF6. N2 washout LCI has recently received a great deal of criticism and some of these criticisms seem to apply to N2 washout lung volumes as well.
Most specifically, a number of studies have noted that the N2 washout FRC is routinely higher than the SF6 FRC and plethysmographic FRC. In addition, the N2 washout LCI tends to be significantly higher than the SF6 LCI and this difference increases as LCI increases.
As examples in a study of patients with COPD the N2 washout FRC averaged 14% higher than the plethysmographic FRC. In other studies of normal subjects the N2 washout FRC was on average 0.20 to 0.21 L higher than plethysmographic FRC. Finally, a study that performed N2 and SF6 washouts simultaneously on CF patients and healthy controls showed the N2 washout LCI to be on average 7.93% higher than SF6 in the healthy controls and 29.13% higher than SF6 in the CF patients. In the same study N2 washout FRC was 12.66% higher than SF6 FRC in the healthy controls and 30.09% higher than SF6 FRC in CF patients.
So why is there such a discrepancy?
One of the primary reasons appears to be N2 excretion from N2 body stores during the 100% O2 washout. Nitrogen excretion is complex because nitrogen comes from a variety of body stores with different time constants. Depending on the time interval during a 100% O2 washout, nitrogen will be excreted from blood first, well perfused tissue second, poorly perfused tissue third and fat last. N2 excretion has been studied several times since the 1930’s and although results are in general similar, the derived formulas differ. In addition, the excretion rates of individuals have been shown to differ due to differences in body mass and in ventilation, and likely for differences in cardiac output, ventilation inhomogeneity and dead space as well.
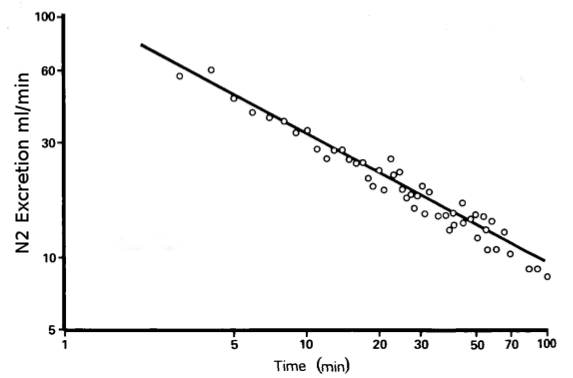
N2 excretion slope. Note that N2 excretion scale is semi-logarithmic. Modified from Beatty PCW, Kay B, Healy TEJ. Measurement of the rates of nitrous oxide uptake and nitrogen excretion in man. Br J Anaesth 1984; 56: Figure 2, page 225.
The extent to which the N2 washout FRC differs from plethysmographic FRC and SF6 washout FRC tends to increases as test time increases. This makes sense in that during longer tests individuals spend a proportionally longer time at lower alveolar N2 concentrations which enhances N2 excretion and increases the relative contribution it makes to exhaled N2. Interestingly, during the latter part of the washout the best ventilated parts of the lung will contain the highest concentrations of oxygen and have the highest N2 gradient. N2 excretion will therefore be highest in these parts of the lung.
There have been several attempts to correct for N2 excretion using both fudge factors and more precise formulaic corrections with varying degrees of success. One study using the formula from Lundin and Cournand showed a partial but not complete decrease in the difference between N2 washout FRC and plethysmographic FRC, and the improvement was greater for normal subjects than it was for those with CF. Another study that used a fudge factor (subtracting 1% from the N2 concentration throughout testing) however, showed FRC and LCI results significantly more similar to to those of SF6 studies.
So N2 excretion is a major factor, but it may not be the sole factor.
The way in which N2 is analyzed has been suggested as another reason for the discrepancy. Specifically in all commercial test systems, N2 is not measured directly, it is instead derived from oxygen and carbon dioxide concentrations. One study showed that the derived N2 signal was reasonably accurate across the entire range of expected concentrations with all measured differences being within 0.12%. Another study however, found that when they presented the analyzers with a zero percent N2 mixture the instrument read between 0.62% and 1.06% N2 (average 0.8%) and that correcting (as well as correcting for N2 excretion) significantly decreased the difference between N2 washout and SF6 washout FRC measurements. Finally, in a letter to the editor the author suggested that an error of 0.2% in O2 concentration, which is within normal limits for most oxygen analyzers, could lead to an error of over 2% in the indirect N2 concentration.
Note: When the N2 concentration is estimated using measured O2 and CO2 concentrations one factor that I’ve not seen explicitly addressed is the argon concentration. Argon makes up approximately 0.9% of air and although it will be washed out along with N2 during an 100% O2 washout it contributes to the resting baseline. In particular, the room air concentration of N2 + AR is 79.01% but most test system presume the starting concentration of N2 used in their calculations to be 78.08%.
Another factor that’s been raised by several researchers is the cutoff N2 concentration. LCI washouts, regardless of which gas is being used, nominally stop when the tracer gas is 1/40th the starting concentration, which is usually considered to be 2% or 2.5%. Several researchers have shown that a higher cutoff such as 5% shortens the washout and decreases the differences between SF6 and N2 washout FRC and LCI. Test sensitivity is reduced with a 5% cutoff but several studies showed that clinical and statistical significance did not change significantly.
It has been repeatedly shown that N2 washout LCI tests produce higher FRC and LCI measurements than testing with SF6. N2 washout tests also tend to be longer than SF6 tests and it has been suggested that a higher cutoff value for N2 would be appropriate. N2 excretion during the 100% O2 washout is likely the primary factor in the discrepancy between N2 and SF6 FRC and LCI results but N2 excretion is complex and not necessarily predictable. Although correcting for N2 excretion reduces the discrepancy it does not eliminate it and it has been suggested that minor offset errors in the gas analyzers may also contribute to the discrepancy.
When appropriate care is taken however, N2 washout values are repeatable and although the magnitude of the results may be exaggerated compared to SF6 their direction and sensitivity remains relevant. This does mean however, that the normal values for LCI testing will depend on which gas is being used.
A final note is that although the 2005 ATS/ERS guidelines for N2 washout lung volumes acknowledges N2 excretion the suggested correction factor:
N2 tissue excretion (mL) = ((BSA x 96.5)+35)/0.8
does not correct for test time and should be considered to be more of a fudge factor than an accurate correction.
References:
Beatty PCW, Kay B, Healy TEJ. Measurement of the rates of nitrous oxide uptake and nitrogen excretion in man. Br J Anaesth 1984; 56: 223-232.
Becklake MR. A new index of the intrapulmonary mixture of inspired air. Thorax 1952; 7: 111-116.
Bell AS, Lawrence PJ, Singh D, Horsley A. Feasibility and challenges of using multiple breath washout in COPD. Int J COPD 2018; 13: 2113-2119.
Benseler A, Stanojevic S, Jensen R, Gustaffson P, Ratjen F. The effect of equipment dead space on multiple breath washout measures. Respirology 2015; 20(3): 459-466.
Brusasco V, Crapo R, Viegi G, et al. Series ATS/ERS task force: Standardisation of lung function testing. Standardisation of the measurement of lung volumes. Eur Respir J 2005; 26: 511-522.
Cournand A YI, Riley RL. Influence of body size on gaseous nitrogen elimination during high oxy-gen breathing. Proc Soc Exp Biol Med 1941; 48: 280–284.
Jensen R, Stanojevic S, Gibney K, Salazar JG, Gustafsson P, et al. (2013) Multiple Breath Nitrogen Washout: A Feasible Alternative to Mass Spectrometry. PLoS ONE 8(2): e56868
Kane M, Stanojevic S, Jensen R, Ratjen F. Effect of tissue nitrogen excretion on multiple breath washout measurements. Eur Respir J 2016; 48: PA370.
Kane M, Rayment JH, Jensen R, McDonald R; Stanojevic S, Ratjen F. Correcting tissue nitrogen excretion in multiple breath washout measurements. PLOS One 2017; 12(10): e0185553.
Lokesh G, Kasi A, Starks M, Pedersen KE, Nielsen JG, Weiner DJ. Difference between SF6 and N2 multiple breath washout kinetics is due to N2 back diffusion and error in N2 offset, J Appl Physiol, 2019; 125(4), 1257-1265.
Lundin G. Nitrogen elimination during oxygen breathing. Acta Physiol Scand 1953; 30: 130–143.
Nielsen JG. Lung clearance index: should we really go back to nitrogen washout (letter to editor). Eur Repir J; 43: 655-656.
Nielsen N, Nielsen JG, Horsley AR. Evaluation of the impact of alveolar nitrogen excretion on indices derived from multiple breath N2 washout. PLOS One 2013; 8(9); e73335.
Robinson PD, Latzin P, Gustafsson PM. Multiple-breath washout. Eur Repir Mon; 47: 87-104.
Nyilas S, Schlegtendal A, Singer F, et al. Alternative inert gas washout outcomes in patients with primary ciliary dyskinesia. Eur Respir J 2017; 49: 1600466
Tonga KO, Robinson PD, Farah CS, King GG, Thamrin C. In vitro and in vivo comparisons between multiple-breath nitrogen washout devices. ERJ Open Research 2017; 3: 00011-2017.
Yammine S, Lenherr N, Nyilas S, Singer F, Latzin P. Using the same cutoff for sulfur hexaflouride and nitrogen multiple-breath washout may not be appropriate. J Appl Physiol 2015; 119: 1510-1512.

PFT Blog by Richard Johnston is licensed under a Creative Commons Attribution-NonCommercial 4.0 International License.
Very informative. Thank you for sharing
Thank you Richard!
It’s great to have you back sharing your knowledge.