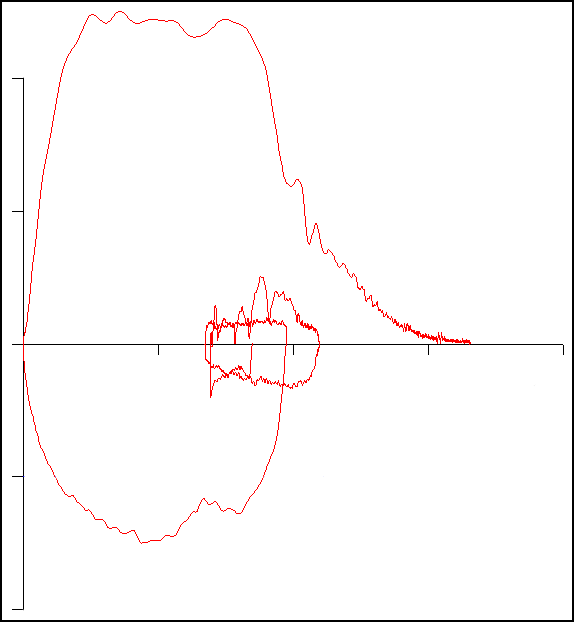
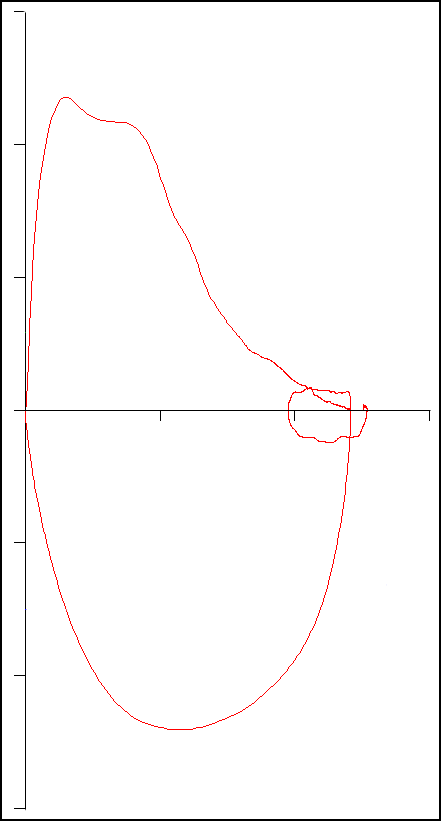
Recently I was reviewing a report that included helium dilution lung volumes. What caught my eye was that the TLC and the FRC didn’t particularly fit in with the results from the other tests the patient had performed.
| Test: |
Observed: |
%Predicted: |
| FVC: |
2.83 |
114% |
| |
|
|
| TLC: |
3.03 |
71% |
| FRC: |
0.88 |
39% |
| RV: |
0.09 |
5% |
| SVC: |
2.93 |
118% |
| |
|
|
| VA: |
3.64 |
88% |
When compared to the FVC and the VA (from the DLCO test) the lung volumes are significantly lower. In particular the FRC and RV are markedly reduced. This is somewhat unusual for helium dilution lung volume since most errors usually cause FRC, RV and TLC to be over-estimated instead of being under-estimated. When I checked the other reports for the day I found that two other patients that had had their lung volumes measured on the same test system also had a TLC, FRC and RV that were noticeably reduced. Obviously we had some kind of equipment problem with that test system but it took a bit of sleuthing before I found out what had happened.
Like all lung volume tests, the helium dilution technique produces a lot of numbers, most of which are not included on the report. One of the first things I did was to call up the within-test data (our test systems store data every 15 seconds during the test and re-calculate FRC each time).
| Time: |
FRC, Liters |
He conc. (%) |
Ve (L./min.) |
Vt, Liters |
| 0:15 |
-1.00 |
9.71 |
6.16 |
0.21 |
| 0:30 |
0.06 |
8.87 |
10.1 |
0.59 |
| 0:45 |
0.43 |
8.61 |
11.76 |
0.78 |
| 1:00 |
0.69 |
8.44 |
9.05 |
0.72 |
| 1:15 |
0.76 |
8.39 |
8.18 |
0.74 |
| 1:30 |
0.79 |
8.37 |
8.32 |
0.59 |
| 1:45 |
0.82 |
8.36 |
8.15 |
0.62 |
| 2:00 |
0.83 |
8.35 |
7.79 |
0.65 |
| 2:15 |
0.86 |
8.33 |
5.51 |
0.62 |
| 2:30 |
0.87 |
8.32 |
5.34 |
0.63 |
| 2:45 |
0.88 |
8.32 |
0 |
0 |
When looking at this it was immediately evident there was a problem because the initial FRC was negative and this shouldn’t be possible. About the only way that helium dilution lung volumes can normally be underestimated is if the test is terminated way too early and the negative FRC ruled this out. It also narrows down the possible problems, but I had to think for a while and in doing so had to go back to the basics of the helium dilution test.
Helium dilution used to be the most common method for measuring lung volumes, but it requires a closed-circuit test system with a volume displacement spirometer. Most current test systems are open-circuit flow sensor-based systems and lung volumes are usually measured by nitrogen washout (or by plethysmography). Nevertheless, there are a couple of closed-circuit systems still being manufactured and there are a fair number of these systems still in service.
Continue reading →


