I’ve always found interpreting CPET tests to be one of the more interesting (and enjoyable) things I’ve done. Interpreting a CPET test is both more difficult and easier than interpreting regular PFTs. More difficult because there are a lot more parameters involved and easier because determining test adequacy and the primary cause(s) of an exercise limitation tends to be clearer.
I’ve found that you have to go back to basic physiology whenever you interpret CPETs and that always boils down to the flow of oxygen and carbon dioxide.
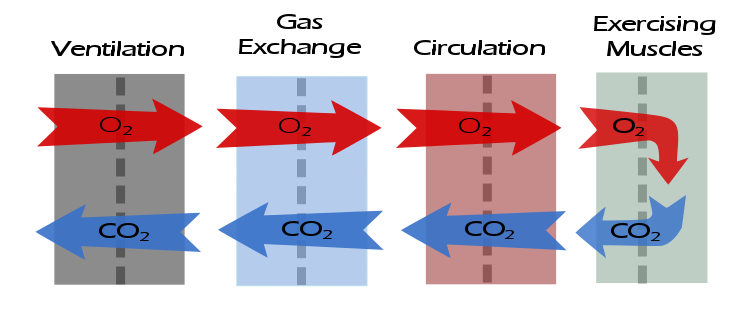
Abnormalities in gas flow that occurs at any of these steps will leave a distinctive pattern in the test results. I’ve developed a structured approach to interpreting CPET results that includes a descriptive part as well as the interpretation and summary. The descriptive part may appear to be tedious but I’ve always found it to be absolutely critical to the actual interpretation.
The descriptive elements for assessing the ventilatory response to exercise are:
What was the baseline spirometry?
Note: Spirometry pre- and post-exercise should always be performed as part of a CPET, even when exercise-induced bronchoconstriction is not suspected. This is so that normal values for the ventilatory response to exercise can be determined.
Example: The FVC was {normal | mildly reduced | moderately reduced | moderately severely reduced | very severely reduced}. The FEV1 was {normal | mildly reduced | moderately reduced | moderately severely reduced | very severely reduced}. The FEV1/FVC ratio was was {normal | mildly reduced | moderately reduced | severely reduced}.
What was the post-exercise change in FEV1?
A decrease in FEV1 ≧ 15% following exercise is abnormal and suggests exercise-induced bronchoconstriction.
Note: FEV1 can increase post-exercise and an increase up to 5% is normal. Some patients with reactive airway disease bronchodilate with exercise and can an increase ≧ 15% from baseline, particularly if they were obstructed to begin with. Although strictly speaking this is not abnormal, it does suggest the presence of labile airways.
Example: There was {a significant decrease / no significant change / a significant increase} in FEV1 following exercise.
What was the maximum minute ventilation (Ve) in percent predicted?
Predicted Ve is calculated from (FEV1 x 40).
Note: MVV tests are generally not useful in determining maximum exercise ventilation because they are of short duration and as importantly, they are an artificial maneuver that many patients have difficulty performing correctly and does not correlate well with the type of ventilation that occurs with exercise.
A normal maximum minute ventilation is usually less than 60% of predicted.
If the maximum minute ventilation is ≧ 85% of predicted then a pulmonary mechanical limitation is present and may be due to a:
1. Restrictive process
2. Obstructive process
3. Hyperventilation
Note: A maximum minute ventilation > 100% of predicted suggests suboptimal baseline spirometry but occasionally occurs in patients with very severe airway obstruction.
Historical Note: The Dyspnea Index (DI, often found in older publications) is ((maximum Ve/predicted maximum minute ventilation) x 100), i.e. percent predicted.
Example: The maximum minute ventilation was XX.X LPM which is X% of predicted and is {within normal limits | elevated}.
What was the minute ventilation at Anaerobic threshold (AT)?
If the CPET test is submaximal a minute ventilation > 45% of predicted at AT is an indication that there is likely a pulmonary mechanical limitation.
Example: The minute ventilation at AT was {within normal limits | elevated}.
What was the resting and maximum tidal volume (Vt)?
A resting Vt is nominally 0.5 to 1.0 L. Vt normally increases by a factor of 2 to 3 from rest to peak exercise. When ventilation increases during exercise tidal volume usually increases first, followed by respiratory rate. A blunted increase in tidal volume (< 2x resting) can be seen in both restrictive and obstructive disease
Note: Some patients breathe slowly and deeply during the baseline period and this will skew the apparent Vt response downwards.
Example: There was a {blunted | normal} increase in tidal volume during exercise.
What was the resting and maximum respiratory rate (RR)?
A resting RR is nominally 10 to 20 breaths per minute and normally increases to between 30 and 40 breaths per minute during exercise.
A resting RR > 25 is abnormal and suggests hyperventilation but is also often seen in pre-test anxiety.
A RR > 55 at peak exercise is abnormal and is most often seen with restrictive diseases.
A blunted increase in RR (<30 at peak exercise) is often seen in obstructive diseases.
Example: There was a {blunted | normal | elevated} increase in respiratory rate during exercise.
What was the E/I ratio at peak exercise?
Note: I prefer to use E/I (expiratory time/inspiratory time) rather than the I:E ratio because it is clearer when you say it is increased or decreased and because it focuses attention on the expiratory part of ventilation.
E/I ratio is nominally 1.0 to 2.0 at rest and should approach 1.0 at peak exercise in normal subjects.
An E/I ratio > 1.5 at peak exercise is usually seen when airway obstruction is present.
An inverse E/I ratio (<1.0) at peak exercise is an indication there may be an inspiratory obstruction.
Example: The E/I ratio was {inverse | normal | elevated} at peak exercise.
What was the Vt/IC ratio at peak exercise?
Note: If it is possible to measure Inspiratory Capacity (IC) then this should be done during the resting baseline period and regularly during exercise. This allows the Vt/IC ratio and changes in the End-Expiratory Lung Volume (EELV) to me calculated. Both the Vt/IC ratio and EELV are critical towards measuring the ventilatory response in patients with airway obstruction.
Note: The Vt/IC ratio can be overestimated from suboptimal IC maneuvers and the maneuver can be difficult to perform at higher levels of exercise. By definition it can never be higher than 1.0.
Note: Always confirm test system measurements of IC and EELV since these machine-generated measurements are often inaccurate due to difficulty in assessing the start of the IC maneuver.
A Vt/IC ratio greater than 0.85 at peak exercise is abnormal and can be seen in both obstructive and restrictive diseases.
Note: A Vt/IC ratio > 0.85 may also be an indication the patient has reached a pulmonary mechanical limitation to exercise even when the maximum minute ventilation was <85% of predicted.
Example: The Vt/IC ratio at peak exercise was {within normal limits | elevated}.
What was the change in EELV at peak exercise?
EELV is calculated from (baseline IC – exercise IC). No change or a decrease is normal. An increase in EELV ≧0.25 L. suggests gas trapping (dynamic hyperinflation) and is usually seen in obstructive disease.
Note: Dynamic hyperinflation can cause the patient to reach a pulmonary mechanical limitation even though the maximum minute ventilation was <85% of predicted.
Example: EELV at peak exercise {decreased by X.X L. | did not change significantly | increased by X.X L) which is {within normal limits | elevated}.
After having gone through this checklist it should be apparent whether the ventilatory response to exercise was normal or abnormal, and as importantly, specifically which element was normal or abnormal.
There are distinctive patterns in the ventilatory response for obstructive and restrictive lung diseases. Even when if a preliminary diagnosis of this kind is not known prior to testing baseline spirometry should at least suggest the presence (or absence) of one or the other.
Depending on the severity of their disease, patients with obstructive lung disease will have:
- a reduced FEV1 and FEV1/FVC ratio
- an elevated maximum minute ventilation
- an elevated minute volume at AT
- a blunted increase in tidal volume
- a blunted increase in respiratory rate
- an elevated E/I ratio
- an elevated Vt/IC ratio
- an elevated increase in EELV
Depending on the severity of their disease, patients with restrictive lung disease will have:
- a reduced FVC and a normal or elevated FEV1/FVC ratio.
- an elevated maximum minute volume
- an elevated minute volume at AT
- a blunted increase in tidal volume
- an elevated increase in respiratory rate
- a normal E/I ratio
- an elevated Vt/IC ratio
- a normal increase in EELV
It should be pointed out that even patients with normal lung mechanics can reach a pulmonary mechanical limitation, either because gas exchange abnormalities cause them to have an exaggerated ventilatory response or by being incredibly fit with an markedly elevated maximum oxygen consumption.
As always however, attention should be paid to test quality as suboptimal spirometry, inspiratory capacity and exercise testing can skew results.
Next: CPET Test Interpretation, part 2: Gas exchange

PFT Blog by Richard Johnston is licensed under a Creative Commons Attribution-NonCommercial 4.0 International License.
wonderful! Thank you!
Thank you very much Richard!!!
AMAZING REVIEW
Thanks for this review! Excellent
Hi Richard,
I’m glad to see your overview of CPET. Your test model of overview is very interesting
Hi, Richard!
Thanks for the great review! We look forward to continuing!
Amazing effort. Thank you.