Thinking about the past

This is the time of the year when it’s traditional to review the past. That’s what “Auld lang syne”, the song most associated with New Year’s celebrations, is all about. I too have been thinking about the past but it’s not been about absent friends, it’s been about trend reports and assessing trends.

In the May 2017 issue of Chest, Quanjer et al reported their study on the post-bronchodilator response in FEV1. I’ve discussed this previously and they noted that the current ATS/ERS standard for a significant post-bronchodilator change of ≥12% and ≥200 ml penalized the short and the elderly. Their finding was that a significant change was better assessed by the absolute change in percent predicted (i.e. 8%) rather than a relative change.

I’ve thought about how this could apply to assessing changes in trends ever since then. The current standards for a significant change in FEV1 over time (also discussed previously) is anything greater than:

which is good in that it is a way to reference changes over any arbitrary time period but it also looks at it as a relative change (i.e. ±15%). A 15% change however, comes from occupational spirometry, not clinical spirometry, and the presumption, to me at least, is that it’s geared towards individuals who have more-or-less normal spirometry to begin with.

A ±15% change may make sense if your FEV1 is already near 100% of predicted but there are some problems with this for individuals who aren’t. For example, a 75 year-old 175 cm Caucasian male would have a predicted FEV1 of 2.93 L from the NHANESIII reference equations. If this individual had severe COPD and an FEV1 of 0.50 L (17% of predicted), then a ±15% relative change in FEV1 would ±0.075 L (75 ml). That amount of change is half the acceptable amount of intrasession repeatability (150 ml) in spirometry testing and it’s hard to consider a change this small as anything but chance or noise. It’s also hard to consider this a clinically significant change. Continue reading

2017 ATS PFT Reporting Standardization

The ATS has released its first standard for reporting pulmonary function results. This report is in the December 1, 2017 issue of the American Journal of Respiratory and Critical Care Medicine. At the present time however, despite its importance it is not an open access article and you must either be a member of the ATS or pay a fee ($25) in order to access it. Hopefully, it will soon be included with the other open access ATS/ERS standards.

There are a number of interesting recommendations made in the standard that supersede or refine recommendations made in prior ATS/ERS standards, or are otherwise presented for the first time. Specific recommendations include (although not necessarily in the order they were discussed within the standard):

  • The lower limit of normal, where available, should be reported for all test results.
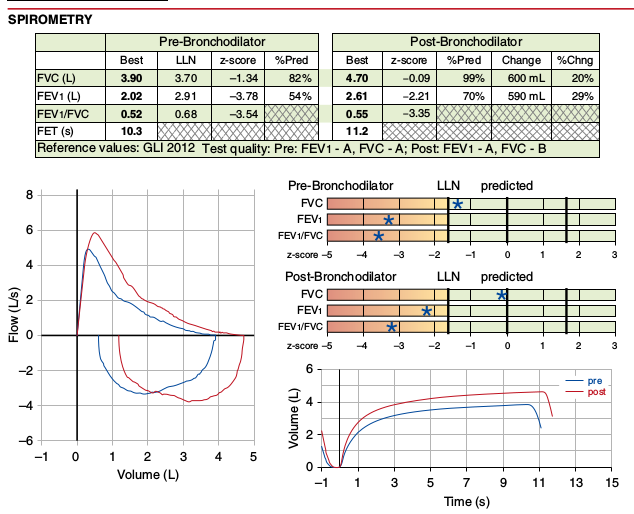
  • The Z-score, where available, should be reported for all test results. A linear graphical display for this is recommended for spirometry and DLCO results.
  • Results should be reported in tables, with individual results in rows. The result’s numerical value, LLN, Z-score and percent predicted are reported in columns, in that recommended order. Reporting the predicted value is discouraged.

Part of Figure 1 from page 1466 of the ATS Recommendations for a Standardized Pulmonary Function Report.

Continue reading

Making Assumptions about TGV and FRC

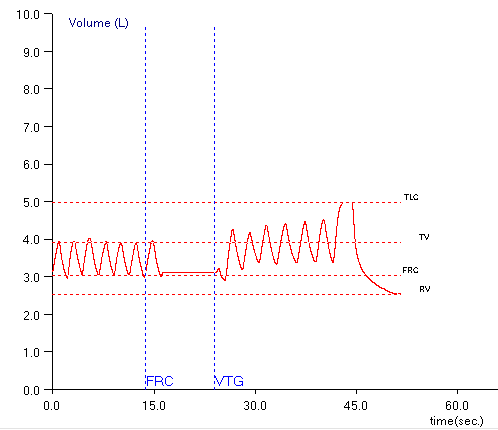
When lung volumes are measured in a plethysmograph the actual measurement is called the Thoracic Gas Volume (TGV). This is the volume of air in the lung at the time the shutter closes and the subject performs a panting maneuver. Ideally, the TGV measurement should be made at end-exhalation and should be approximately equal to the Functional Residual Capacity (FRC). For any number of reasons in both manual and automated systems this doesn’t happen and the point at which the TGV is measured is either above or below the FRC.

Testing software usually corrects for the difference in TGV and FRC by determining the end-exhalation baseline that is present during the tidal breathing at the beginning of the test. Using this value the software can determine where the TGV was measured relative to the tidal breathing FRC and then either subtracts or adds a correction factor to derive the actual FRC volume.

One problem with this is that leaks in either the subject or the mouthpiece and valve manifold can occur during the panting maneuver and the end-exhalation baseline can shift and this will affect the calculation of RV and TLC. I’ve discussed this previously and as a reminder, RV is calculated from:

RV = [average FRC] – [average ERV]

where the FRC is determined from the corrected TGV and ERV is determined from SVC maneuvers. TLC is then calculated from:

TLC = RV + [largest SVC]

When the post-shutter FRC baseline shifts upwards (higher lung volumes relative to the pre-shutter FRC):

ERV is underestimated, which in turn causes both RV and TLC to be overestimated. When the post-shutter FRC baseline shifts downwards (lower lung volumes relative to the pre-shutter FRC):

ERV is overestimated, which in turn causes both RV and TLC to be underestimated.

I’ve been aware of this problem for quite a while and use this as a guideline when selecting the FRCs and SVCs from specific plethysmograph tests. All of these assumptions are based on the fact that FRC is derived from the pre-shutter end-exhalation tidal breathing. Well, you know what they say about assuming…

Continue reading