New Year’s Resolutions for a better PFT lab

It’s a tradition to come up with New Year’s resolution in order to improve ourselves. How about some resolutions to improve our labs?

1. Review and update the procedure manual

When was the last time you reviewed your procedure manual? Procedure manuals should be reviewed by the lab manager and medical director annually. It’s time to re-read the ATS/ERS guidelines and then review and update your procedure manual. Both your old staff and your new staff need to know what to do and how to do it. Your procedure manual is also going to be the first thing that anybody looks at if your lab is ever inspected.

2. Biological QC

Daily calibrations (and you’re doing daily calibrations and keeping a log of them, aren’t you?) are not enough to make sure our test systems are operating correctly. Regular (weekly, bi-weekly or monthly) biological quality control on ourselves with a Levey-Jennings chart is still the best way to do this. Don’t put it off. Biological QC is not an option; it’s a minimum requirement for any medical lab.
Continue reading

Is there airway obstruction when the FEV1 is normal?

I’ve been reviewing the literature on PFT interpretation lately and in doing so I ran across one of the issues that’s bothered me for a while. Specifically, my lab has been tasked with following the 2005 ATS/ERS guidelines for interpretation and using this algorithm these results:

Observed: %Predicted: LLN: Predicted:
FVC: 2.83 120% 1.76 2.36
FEV1: 1.77 100% 1.26 1.76
FEV1/FVC: 63 84% 65 75

would be read as mild airway obstruction.

Although it’s seems odd to have to call a normal FEV1 as obstruction I’ve been mostly okay with this since my lab has a number of patients with asthma whose best FVC and FEV1 obtained at some point in the past were 120% of predicted or greater but whose FEV1 frequently declines to 90% or 100% of predicted. In these cases since prior studies showed a normal FEV1/FVC ratio then an interpretation of a mild OVD is probably correct even though the FEV1 itself is well above the LLN, and this is actually the situation for this example.
Continue reading

Fick Cardiac Output

We’ve all run across the Fick equation for cardiac output at one time or another. There are very limited circumstances when we’d ever get to use it but at the same time it’s one of those simple but incredibly profound equations that’s also a foundation of pulmonary physiology.

The Fick equation is:

where:

VO2 = oxygen uptake

CvO2 = mixed venous oxygen content

CaO2 = arterial oxygen content

And what it describes is:

It’s a mass-balance equation that basically says that what goes in must come out, but how do you get from oxygen uptake to cardiac output?
Continue reading

N2 washout troubleshooting

I was recently contacted by the manager of a lab that was having problems with their N2 washout lung volumes. Specifically, their N2 washout lung volumes (FRC in particular) were coming out low and everyone being tested on the system looked like they had restriction. The system has been checked by the manufacturer’s service techs several times and they’d replaced the tubing, the O2 tank and a number of parts. Service first asked them to wait between tests and then not to bother. Most lately they’ve been asked to calibrate the system before each test. Despite all this, their system continues to under-estimate lung volumes.

We’ve all had seemingly intractable problems with our test systems at one time or another. Sometimes they’re problems that can only be fixed by replacing major components, such as a gas analyzer or a motherboard. Sometimes they turn out to be something simple that nobody noticed despite looking straight at it numerous times. Experience and good technical support helps, but for every test system there has to be at least a couple of problems that are either uncommon, difficult to diagnose or are happening for the first time. When this happens it’s best to go back to basics and try to see what it is that’s most likely to explain the symptoms.

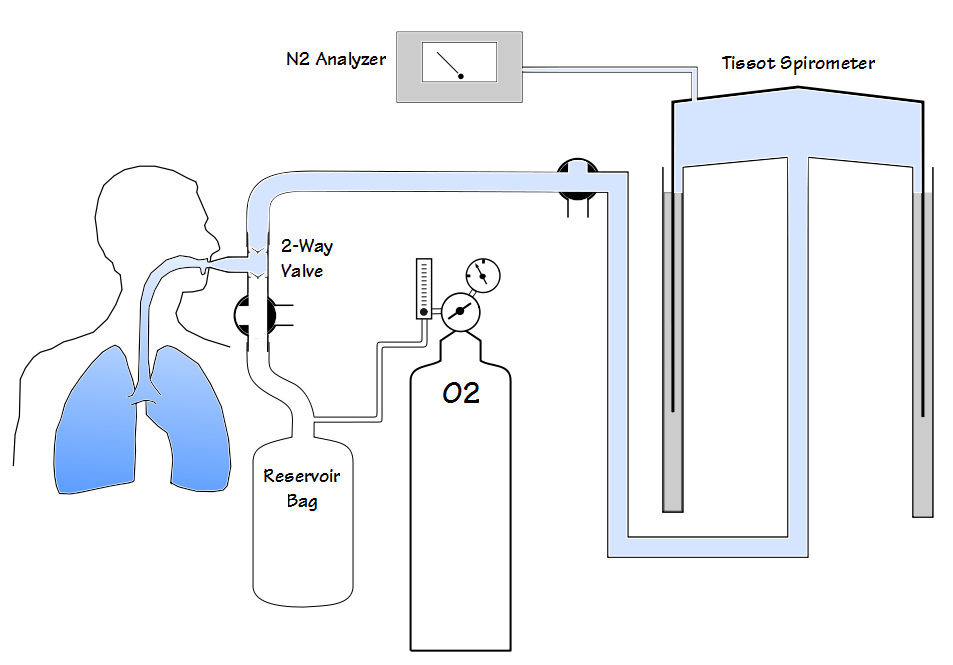
N2 washout lung volume measurements measure the amount of nitrogen residing in the lung and use this to estimate the volume of the entire lung. Closed circuit lung volume measurements using nitrogen were first attempted in 1932 by Christie. Christie’s approach used a known volume of oxygen to dilute the nitrogen in the lung but accuracy was limited at least in part because the amount of oxygen in the closed circuit was constantly changing due to the subject’s oxygen uptake. In 1940 Darling et al demonstrated an open circuit technique that is the basis for current N2 washout tests. In this approach the nitrogen in a subject’s lung was washed out with 100% O2 and their exhaled air was collected in a Tissot spirometer. After a certain amount of time (nominally 7 minutes) the exhaled volume and the N2 concentration in the Tissot spirometer was measured. The amount of nitrogen that had been exhaled is then calculated using simple math and the subject’s FRC is estimated from that.

Continue reading