VA, two ways

One of the recommendations in the 2017 ERS/ATS DLCO standards was that VA should be calculated using a mass balance equation. I’ve discussed this approach previously, but basically the volume of the exhaled tracer gas is accumulated over the entire exhalation and the amount of tracer gas presumed to remain in the lung is used to calculate VA. The conceptual problem with this for DLCO measurements is that VA is calculated using the entire exhalation but CO uptake is based solely on the CO concentration in the alveolar sample. Since VA calculated using mass balance tends to be larger than VA calculated traditionally in subjects with ventilation inhomogeneities this mean that DLCO calculated with a mass balance VA is also going to be proportionally larger as well.

This problem has concerned me for a while but what wasn’t clear was what difference should be expected in the VA (and DLCO) when it is calculated both ways. In order to figure this out I’ve taken a real-world example of a subject with severe COPD and calculated the difference in VA and DLCO.

Fortunately, my lab software lets me download the raw data for DLCO tests (volume, CH4, CO at 10 msec intervals) into a spreadsheet. The PFT results for the subject looked like this:

  Observed: %Predicted:
FVC (L): 2.39 97%
FEV1 (L): 0.66 36%
FEV1/FVC: 27 38%
     
TLC (L): 6.11 126%
FRC (L): 4.84 174%
RV (L): 4.04 171%
     
DLCO: 9.21 57%
VA (L): 3.19 68%
Vinsp (L): 2.32  

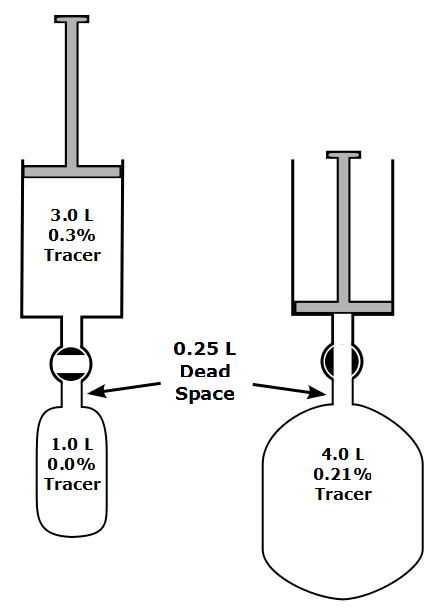
In order to use the mass balance approach with the spreadsheet I found that I could determine the start of exhalation after the breath-holding period but determining where the alveolar plateau started was much more difficult. For this reason I had to include the dead space but made adjustments for this when calculating VA.

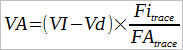
To start off with, using the inspired volume and concentration of CH4 in the DLCO test gas mixture, the volume of inhaled CH4 was:

2.32 L x 0.003 = 6.96 ml.

Continue reading

Is there such a thing as a normal decrease when the FEV1 isn’t normal?

I’ve mentioned before that my lab’s database goes back to 1990, so we now have 27 years of test results available for trending. At least a couple times a week we have a patient who was last seen 10 or even 20 years ago. When I review their results I try to see if there has been any significant change from their last tests. Since the last tests are often quite some time in the past the changes in an absolute sense are often noticeably large. The question then becomes whether or not these changes are normal.

Although the ATS/ERS, NIOSH and ACOEM standards for spirometry address changes over time they don’t specifically discuss changes over a decade or longer. Instead, without indicating a time period (other than saying a year or more), the concensus is that a change greater than 15% in age-adjusted FVC or FEV1 is likely to be significant. A change in absolute values greater than:

Or if the current FEV1 is less than:

Then the change is likely significant.

This sounds fairly reasonable and although we could quibble about the importance of how quickly or slowly this age-adjusted 15% change occurs and how well it applies when the patient’s latest age is beyond the reference equation’s study population (we have a fair number of 90+ year old patients nowadays) or when it’s across a developmental threshold (adolescent to adult), it’s still a good starting point.

I’ve been more or less following these rules for the last several years, when the results for a patient whose last test was 18 years ago came across my desk. The FEV1 from the current spirometry was 71% of predicted and the FEV1 from 18 years ago was 70% of predicted. Strictly speaking the absolute change was about -15% (the FEV1 was 2.06 L in 1999 and 1.76 L in 2017, a 0.30 L change) but when adjusted for the change in age, that’s only 40% what a significant change would need to be:

Given that the FEV1 percent predicted from both the older and newer test were essentially identical I automatically started to type “The change in FEV1 is normal for the change in age” when it suddenly occurred to me that neither FEV1 was normal in the first place so how could I be sure the change be normal?

Continue reading

Calculating VA the mass balance way

One of the more significant changes that appeared in the 2017 ERS/ATS DLCO standards was the requirement that rapid-response gas analyzer (RGA) systems calculate VA using a mass balance approach. This is actually more straightforward than it sounds but it does raise several issues that weren’t fully addressed in the 2017 standards.

Up until this time VA has been calculated from the inspired volume and by the amount of dilution of the tracer gas in the exhaled alveolar sample. Specifically:


Which is described by:

Where:

VI = inspired volume

Vd = Anatomical and Machine deadspace

Fitrace = Inspired tracer gas concentration

FAtrace = Exhaled tracer gas concentration

The basic concept behind the mass balance approach to measuring VA is relatively simple and is described in the 2017 standard as:

…the tracer gas left in the lung at end exhalation is equal to all of the tracer gas inhaled minus the tracer gas exhaled.”

Continue reading

Is there airway obstruction when the FEV1 is normal?

I’ve been reviewing the literature on PFT interpretation lately and in doing so I ran across one of the issues that’s bothered me for a while. Specifically, my lab has been tasked with following the 2005 ATS/ERS guidelines for interpretation and using this algorithm these results:

Observed: %Predicted: LLN: Predicted:
FVC: 2.83 120% 1.76 2.36
FEV1: 1.77 100% 1.26 1.76
FEV1/FVC: 63 84% 65 75

would be read as mild airway obstruction.

Although it’s seems odd to have to call a normal FEV1 as obstruction I’ve been mostly okay with this since my lab has a number of patients with asthma whose best FVC and FEV1 obtained at some point in the past were 120% of predicted or greater but whose FEV1 frequently declines to 90% or 100% of predicted. In these cases since prior studies showed a normal FEV1/FVC ratio then an interpretation of a mild OVD is probably correct even though the FEV1 itself is well above the LLN, and this is actually the situation for this example.
Continue reading