We’ve all run across the Fick equation for cardiac output at one time or another. There are very limited circumstances when we’d ever get to use it but at the same time it’s one of those simple but incredibly profound equations that’s also a foundation of pulmonary physiology.
The Fick equation is:
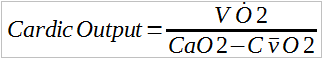
where:
VO2 = oxygen uptake
CvO2 = mixed venous oxygen content
CaO2 = arterial oxygen content
And what it describes is:
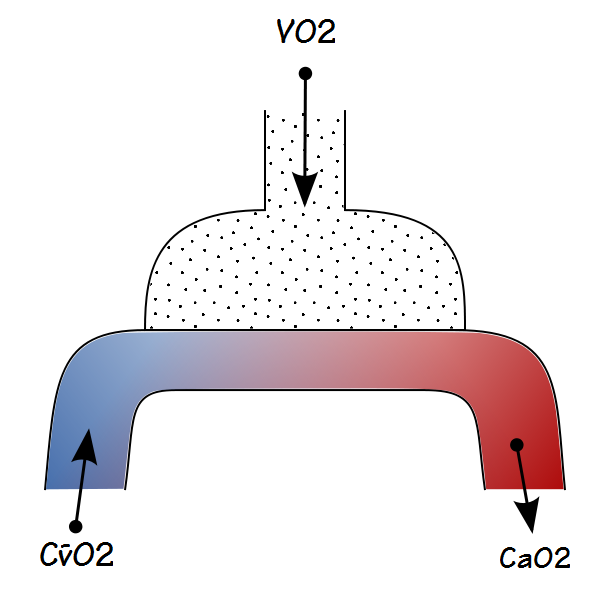
It’s a mass-balance equation that basically says that what goes in must come out, but how do you get from oxygen uptake to cardiac output?
The key part to this is oxygen content. The most common form of the oxygen content calculation is:
O2 Content (ml/decaliter) = (Hgb x 1.36 x SaO2) + (0.0031 x PaO2)
Where:
Hgb = hemoglobin (grams/decaliter)
SaO2 = fractional oxygen saturation
PaO2 = partial pressure of O2 (mmHg)
If normal arterial values were plugged in, it would look like:
O2 Content (ml/decaliter) = (14.6 x 1.36 x 0.98) + (0.0031 x 100)
which calculates to 19.76 ml/decaliter.
The constants in this equation are based on the fact that hemoglobin in expressed in grams/decaliter but oxygen uptake is usually expressed in L/min or ml/min so in order to be compatible in the Fick equation it is usually modified as:
O2 Content (ml/L) = 10 x ((Hgb x 1.36 x SaO2) + (0.0031 x PaO2))
or
O2 Content (L/L) = 0.01 x ((Hgb x 1.36 x SaO2)+(0.0031 x PaO2))
Note: One fascinating point the O2 content equation shows is that the amount of oxygen in blood is almost the same as it is in air. Without hemoglobin or a molecule similar to it the amount that would be in suspension is described by the second part of the equation (0.0031 x PaO2) which is only about 1.6% of the total amount. If we didn’t have hemoglobin then neither we nor any other animal could maintain any kind of a high-energy metabolism.
The difference between mixed venous and arterial O2 content indicates the amount of “space” that’s available for oxygen. For example, at rest mixed venous blood would nominally contain:
CvO2 = 10 x ((14.6 x 1.36 x 0.75) + (0.0031 x 40)) = 150 ml
and for arterial blood is:
CaO2 = 10 x ((14.6 x 1.36 x 0.98) + (0.0031 x 100)) = 198 ml
Therefore, for every liter of blood, the amount of space available for oxygen is:
198 ml – 150 ml = 48 ml
At rest, oxygen uptake is nominally 250 ml, so for the above a-v O2 content difference, this amount of oxygen would need:
250/48 = 5208 ml
of blood. Since VO2 is expressed in ml/min this means that cardiac output would have to be 5208 ml/min or 5.208 L/min.
During exercise, oxygen uptake can increase many times above its resting value. Cardiac output increases also, but not as much and the reason for this is that the a-v O2 content difference increases. At rest mixed-venous blood has a PO2 of approximately 40 but during exercise it easily decrease to 30 mmHg (with oxygen saturation of 54%) or even lower. When this happens O2 content of mixed venous blood is:
CvO2 = 10 x ((14.6 x 1.36 x 0.54) + (0.0031 x 30)) = 108 ml
Assuming that the arterial oxygen content remains the same, then the a-v O2 content difference would be 90 ml and for an O2 uptake of 1500 ml/min (a six-old increase) cardiac output would be:
1500/90 = 16.67 L/min
which is only 3.2 times as great. This means there is a relationship between oxygen uptake and cardiac output, but without knowing the a-v O2 content difference the exact relationship has to be unknown.
As useful as it might be to measure cardiac output during exercise, unfortunately for us (and probably fortunately for our patients) mixed-venous blood can only be obtained from a catheter whose tip is placed in the pulmonary artery or in the vena cava just outside the right ventricle. This type of cathetrization is more than just a bit invasive and is therefore usually only performed under the controlled circumstances of the ICU and cardiac cath labs.
The most important point shown by the Fick equation is that oxygen uptake has a very limited ability to increase without a somewhat corresponding increase in cardiac output. Interestingly, although the converse is mostly true:
![]()
there are circumstances where the a-v O2 content difference can be decreased and when this happens, cardiac output can be elevated but O2 uptake can be normal. One example of this is mitochondrial myopathies where, due to a decreased O2 uptake by body tissue, the mixed-venous PO2 can be as high as 70 (with an oxygen saturation of 93.8%). Under these conditions the mixed-venous O2 content would be:
CvO2 = 10 x ((14.6 x 1.36 x 0.938) + (0.0031 x 70)) = 188 ml
and cardiac output could be as high as:
250/(198-188) = 25.0 L/min
at rest. But this is an unusual circumstance which is unlikely to be seen for most individuals.
The most important point is that there is a connection between cardiac output, oxygen uptake and the O2 content of blood. These are all core components of pulmonary physiology and the Fick equation eloquently describes their relationship.

PFT Blog by Richard Johnston is licensed under a Creative Commons Attribution-NonCommercial 4.0 International License
In ’75-76 I worked on a GE study, looking at cardiac output determinations via a ‘on line’ method. We compared direct fick, thermodilution, and what GE was calling ‘on line cardiac output’.
It was conducted at two places: Stanford and, unbelievably, Anchorage AK, Anchorage Community Hospital, later re-named Alaska Hospital MC.
The ‘on line’ was done via a 9 ga. (!), it had a fiberoptic end that would do oxygen sat, and a formula to convert to oxygen content….the patient had to be intubated, the vent exhalation port was gated to a perkin elmer mass spec for VO, again calculated by the GE computer using a standard formula via the known FiO2 and FeO2 and CO2.
The whole idea was that patients could be given drugs and the effect immediately seen on the ‘on line’ method.
The study fizzled for a variety of reasons, one being the fiberoptic end of the catheter got plaque on it within 48 hours, and would be inaccurate when compared to the direct fick and thermodilution method.
But it was an interesting study to be involved in, taught me a lot.
Cheers, happy holidays,
Mikek
Mike –
In the mid-70’s the Pulmonary department I was working in got a Vacumetrics mass spectrometer. It came with indwelling arterial catheters (silastic coating over a stainless steel catheter with slits in it) that were attached to the mass spec’s inlet and were supposed to measure PaO2 in real-time. Never got them to work (never read accurately) and the silastic coating over the slits would get covered in blood thrombus in a couple of hours at most even when we soaked them in heparin ahead of time. We ended up using the mass spec for a variety of gas analysis tasks and it was still working when I left that hospital almost 10 years later.
– Richard