Which time is it?

The ATS/ERS standard for spirometry recommends reporting the highest FEV1 and the highest FVC even when they come from different tests. Our lab software allows us to do this, but only with some annoying limitations. One of the bigger limitations has to do with how expiratory time is reported. In particular, expiratory time is lumped in with a number of other values like Peak Flow (PEF) and FEF25-75. As importantly, the flow-volume loop and volume-time curve can only come from a single effort.

Our lab software defaults to choosing a single effort with the highest combined FVC+FEV1. The technician performing the tests will override this when other spirometry efforts have a larger FVC or a better FEV1 (which is chosen not just if it is higher but also on the basis of peak flow, back-extrapolation and other quality indicators). The usual order for this is to first choose a spirometry effort with the “best” FEV1, then if there is a different effort with a larger FVC that FVC is selected for reporting. When things are done this way what happens is that the expiratory time, flow-volume loop and volume-time curve that come from the effort selected for its FEV1 are reported. This means is that the expiratory time and volume-time curve often don’t match the reported FVC.

I always take a look at the raw test data whenever a spirometry report comes across my desk with an expiratory time less than 6 seconds or the technician noted that the spirometry effort is a composite. What I often find is that even though the reported expiratory time may be low, the FVC actually comes from an effort with an adequate expiratory time. Although I can select the right expiratory time the problem is that doing so also selects the PEF and the PEF from the effort with the highest FVC is often significantly less than the effort from the best FEV1. The same problem applies to selecting the volume-time curve since the associated flow-volume loop often doesn’t match the effort with the best FEV1 and best PEF. For these reasons I only select the correct expiratory time and volume-time curve when it doesn’t really affect the flow-volume loop and PEF.

However, I’ve always assumed that the expiratory time from the effort with the highest FVC was probably the most correct expiratory time. Yesterday however, this spirometry effort came across my desk:
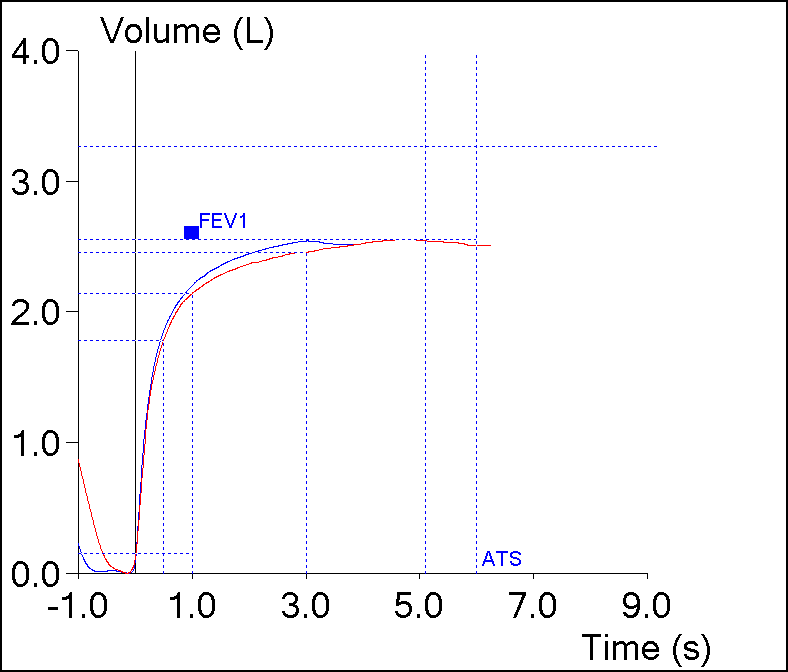
Blue Red
FVC: 2.53 2.54
FEV1: 2.19 2.13
FEV1/FVC: 86 84
PEF: 6.94 5.07
Exp. Time: 3.05 5.09

Continue reading

Calculating VA the mass balance way

One of the more significant changes that appeared in the 2017 ERS/ATS DLCO standards was the requirement that rapid-response gas analyzer (RGA) systems calculate VA using a mass balance approach. This is actually more straightforward than it sounds but it does raise several issues that weren’t fully addressed in the 2017 standards.

Up until this time VA has been calculated from the inspired volume and by the amount of dilution of the tracer gas in the exhaled alveolar sample. Specifically:


Which is described by:

Where:

VI = inspired volume

Vd = Anatomical and Machine deadspace

Fitrace = Inspired tracer gas concentration

FAtrace = Exhaled tracer gas concentration

The basic concept behind the mass balance approach to measuring VA is relatively simple and is described in the 2017 standard as:

…the tracer gas left in the lung at end exhalation is equal to all of the tracer gas inhaled minus the tracer gas exhaled.”

Continue reading

ERS/ATS 2017 DLCO standards

The new ERS/ATS standards for DLCO testing were published in the January issue of the European Respiratory Journal. The article was published as open access and can be downloaded from the ERJ website.

The biggest difference between the new standards and those from 2005 is that they are now primarily oriented towards Rapid-response Gas Analyzers (RGA). The authors explicitly state that the new standards do not make older systems that use discrete alveolar sampling and slower gas analyzers obsolete, but many of the new suggestions and requirements for labs and manufacturers require systems with a RGA.

The differences between the 2017 and 2005 standards that I’ve been able to find include:

♦ Flow accuracy was not specified in the 2005 standard but is now required to be ± 2% over a range of ± 10 L/sec.

♦ Volume accuracy is now required to be ± 2.5% (± 75 ml) instead of ± 3.5%. Notably the 2005 standard included a ± 0.5% error in the calibrating syringe. The accuracy of the 3-liter syringe is now stated separately. In the 2005 standard volume accuracy was over an 8-liter range. No volume range is specified in the 2017 standard.

♦ RGA response time (analyzer rise time) had not previously been specified but is now required to be ≤150 milliseconds. Sample transit time was discussed but no specific recommendations were made. Sample transport issues such as Taylor dispersion, gas viscosity and turbulence at gas fittings was also discussed and although it was suggested that manufacturers attempt to minimize these effects no specific recommendations were made.

♦ Analyzer linearity for both RGA and discrete sample systems has been relaxed to ± 1.0% in the 2017 standards from ± 0.5% in the 2005 standards.

♦ CO analyzer accuracy for both RGA and discrete sample systems is now specified as ≤10 ppm (which is ±0.3% of 0.3% CO). It was previously specified as ± 0.0015% (which is ± 0.5% of 0.3% CO).

♦ Interference from CO2 and water vapor for both RGA and discrete sample systems is now specified as ≤10 ppm error in CO (when CO2 and water vapor are ≤5%). Interference was recognized as a problem in the 2005 standard but error limits were not specified.

♦ Digital sampling rate was not discussed or specified in the 2005 standards. It is now specified as a minimum of ≥100 hz with a resolution of 14 bits. A 1000 hz sampling rate is recommended.
Continue reading