3-Equation DLCO

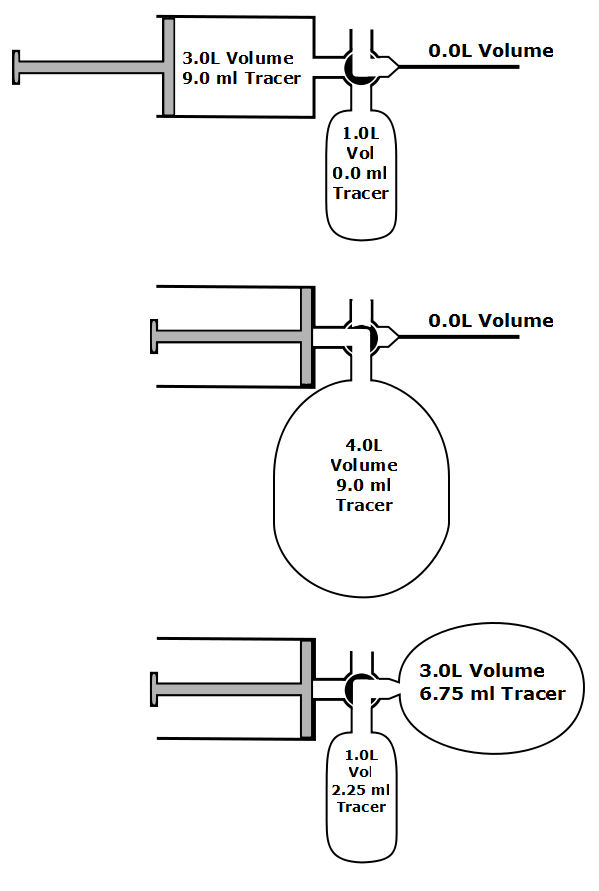
One of the limitations of the single-breath DLCO is that the equation used to calculate results implicitly assumes that the entire breath-holding period occurs at TLC. Mathematically, what happens to the diffusion of carbon monoxide (CO) during inspiration and expiration is not a consideration:

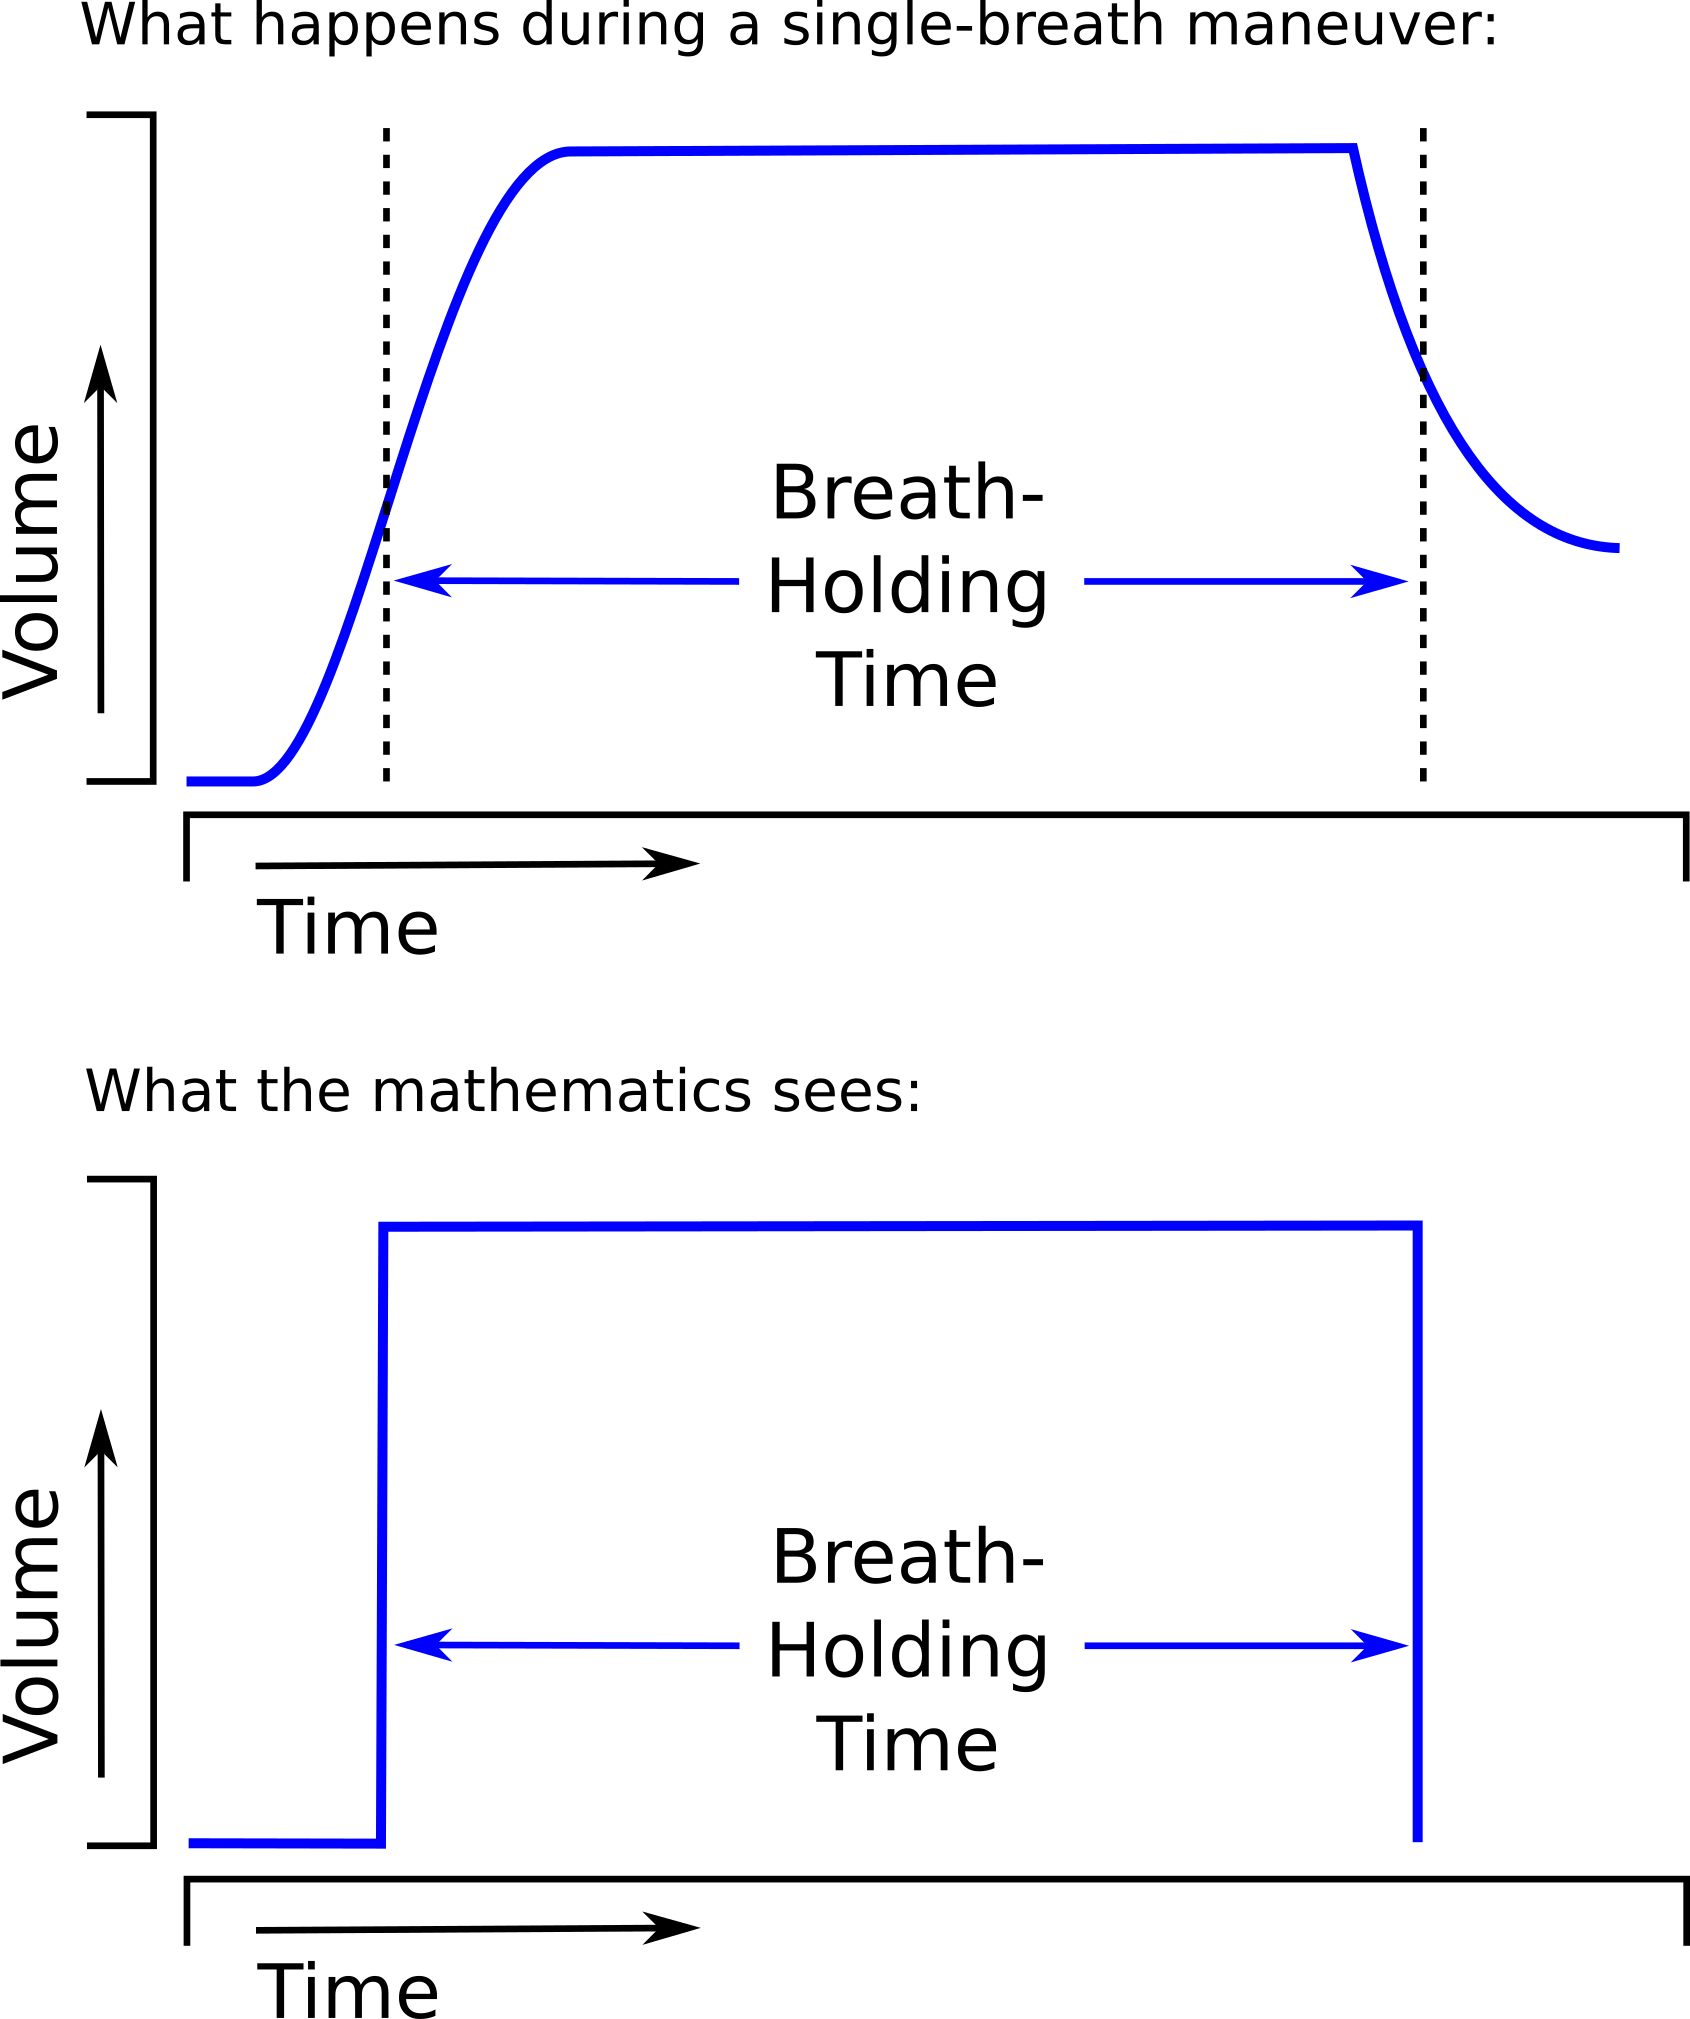
The different approaches towards measuring breath-holding time (BHT) make allowances for inspiration and expiration to one extent or another but realistically they should be considered fudge factors.

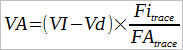
The 3-equation DLCO was first proposed by Graham et al in 1980 and it received its name because there is a separate equation for each phase of the single-breath DLCO maneuver. The individual equations are based on the mass-balance equation and attempt to account for the mass of CO inhaled, absorbed and exhaled during the single-breath maneuver. One of the most significant differences is that an iterative approach is used to determine DLCO. Specifically, an initial estimate of DLCO is made and then compared against the values measured during the three phases. Any differences in observed versus expected values is used to re-estimate the DLCO, and then re-compare it. The authors indicated that 10 iterations are usually sufficient to converge on a DLCO value that meets all measured conditions with a high degree of accuracy.

Continue reading

VA, two ways

One of the recommendations in the 2017 ERS/ATS DLCO standards was that VA should be calculated using a mass balance equation. I’ve discussed this approach previously, but basically the volume of the exhaled tracer gas is accumulated over the entire exhalation and the amount of tracer gas presumed to remain in the lung is used to calculate VA. The conceptual problem with this for DLCO measurements is that VA is calculated using the entire exhalation but CO uptake is based solely on the CO concentration in the alveolar sample. Since VA calculated using mass balance tends to be larger than VA calculated traditionally in subjects with ventilation inhomogeneities this mean that DLCO calculated with a mass balance VA is also going to be proportionally larger as well.

This problem has concerned me for a while but what wasn’t clear was what difference should be expected in the VA (and DLCO) when it is calculated both ways. In order to figure this out I’ve taken a real-world example of a subject with severe COPD and calculated the difference in VA and DLCO.

Fortunately, my lab software lets me download the raw data for DLCO tests (volume, CH4, CO at 10 msec intervals) into a spreadsheet. The PFT results for the subject looked like this:

  Observed: %Predicted:
FVC (L): 2.39 97%
FEV1 (L): 0.66 36%
FEV1/FVC: 27 38%
     
TLC (L): 6.11 126%
FRC (L): 4.84 174%
RV (L): 4.04 171%
     
DLCO: 9.21 57%
VA (L): 3.19 68%
Vinsp (L): 2.32  

In order to use the mass balance approach with the spreadsheet I found that I could determine the start of exhalation after the breath-holding period but determining where the alveolar plateau started was much more difficult. For this reason I had to include the dead space but made adjustments for this when calculating VA.

To start off with, using the inspired volume and concentration of CH4 in the DLCO test gas mixture, the volume of inhaled CH4 was:

2.32 L x 0.003 = 6.96 ml.

Continue reading

The effect of errors in Inspiratory Volume on DLCO.

Yesterday while reviewing reports I ran across an interesting error in the Inspiratory Volume (VI) from a DLCO test. I’ve probably seen this before but this time I realized what effect it could have on DLCO. Specifically, what I saw was that at the start of the DLCO test the subject had not finished exhaling and although the technician had started the test, the subject continued to exhale.

What makes this interesting is that the software used the subject’s volume at the start of the test as the initial volume. This means that the software measured the VI from the initial volume to the end of inspiration, not from the point at which the subject stopped exhaling to the end of inspiration. This also means that the VI was underestimated by 0.20 L and this affects both VA and the calculated DLCO.

Continue reading

DLCO, de-constructed

My wife watches the Food Network a lot and I occasionally watch it with her but I can only take so much of it before I go off and read or work on one of my projects. I’ve noticed however in the various cooking contests that sometimes a chef will deconstruct a familiar recipe. This more or less means they break the recipe down into its components and present them as separate pieces or perhaps by putting what goes inside on the outside instead.

I’ve discussed the DLCO test with numerous people and have found that many know and understand (or at least remember) the ATS/ERS criteria for test quality. At the same time however, there seems to be very few people that understand the formula used to calculate the single-breath DLCO and I suspect this is probably because most of us didn’t like the mathematics classes we had to attend in high school or college (and tried to forget what we learned as quickly as we could afterwards).

The DLCO formula isn’t that complicated however, and more importantly all the components of the DLCO test and the reasons for the ATS/ERS quality criteria are embedded within it. All this seems to be a good reason to de-construct the DLCO “recipe” and try to explain it’s various pieces.

As a reminder the single-breath DLCO formula is:

Where:

VA = alveolar volume in ml

BHT = breath holding time in seconds

Pb = barometric pressure

PH2O = partial pressure of water vapor in the lung

FITrace = fractional concentration of tracer gas in the inspired DLCO mixture

FATrace = fractional concentration of tracer gas in the alveolar sample

FICO = fractional concentration of CO in the inspired DLCO mixture

FACO = fractional concentration of CO in the alveolar sample

I think the part that bothers everybody the most is:

and that’s because there’s two different things going on here. First, the part within the brackets:

is intended to correct the initial CO concentration for the dilution that occurs when the DLCO test gas mixture is inhaled and mixes with the gas that was within the lung at the start of the inhalation. The whole point of the DLCO test is to measure CO uptake but the initial concentration for this measurement is not what’s in the tank, it’s what’s in the lungs after it has been diluted by the lung’s residual volume and deadspace gas.
Continue reading

What’s normal about the GLI DLCO reference values?

The Global Lung Initiative (GLI) has been working for several years to develop a universal reference equation for DLCO. Although this endeavor is not necessarily complete, an article describing the GLI DLCO reference equation for Caucasians was published in the September issue of the European Respiratory Journal as an open access article and can be downloaded by anyone. The Global Lung Initiative in general and the authors of the article more particularly are to be commended for this monumental work and for the insight it brings to understanding the normal distribution of DLCO.

The data used to develop the GLI reference equations was originally derived from 19 studies the GLI identified to have been performed on lifetime nonsmoking populations. 85% of the results came from Caucasian populations and the remaining from two Asian sources. The authors felt that there weren’t a sufficient number of non-Caucasians to accurately describe any ethnicity-based differences in DLCO and for this reason only the Caucasian data was used.

From this data some results were excluded because of:

  • FEV1 > 5 Z-scores or < 5 Z scores
  • Height (children only, >5 or <5 Z scores)
  • VA less than VC
  • Elevated BMI (>30 kg/m2 in adults, >85% centile in children)
  • Missing demographic information

After these exclusions 9710 results remained of which 4859 were male and 4851 were female. DLCO values were corrected for altitude and FiO2 and uncorrected for hemoglobin. Reference equations were derived using the LMS (Lambda, Mu, Sigma) method.

Note: The study population consisted of individuals from 4.5 to 91 years of age and GLI reference equations are valid across this entire span. The majority of the existing DLCO reference equations available to me are for an adult population and for this reason this discussion of the GLI DLCO reference equations will be limited to this portion of the age range. The GLI article also includes reference values for KCO and VA but these subjects will also be saved for a separate discussion.

Not surprisingly, DLCO is highest in tall and young individuals, and lower in short and elderly ones.

Continue reading

What’s wrong with an elevated DLCO?

Well, not necessarily anything, although as usual that depends on the circumstances. Recently I was contacted by an individual who was concerned that their DLCO had decreased from 120% of predicted to 99% of predicted. They also mentioned that their DLCO results have normally ranged from 117% to 140% of predicted over the last 9 months.

More interestingly however, they said that

“the technician told me before I even took the test that anything over 100% for DLCO is essentially a testing error.”

Wow. That statement is wrong on so many levels it’s hard to know where to start but I’ll give it a shot anyway.

First, there are a variety of DLCO reference equations. The ATS/ERS guidelines recommends that PFT Labs pick the reference values that most closely matches their patient population but how this is done is left to individual labs. There are at least a couple dozen DLCO reference equations to choose from and probably about a half dozen of these are in common use in PFT labs around the world.

Because no patient population is ever going to precisely match those of a study this means that DLCO results are going to tend to be above or below 100% of predicted depending on which reference equation the lab is actually using. This also means that if results from otherwise normal subjects are mostly above or mostly below 100% of predicted then the wrong reference equations are being used.

Continue reading

Contraindications

A couple weeks ago I was asked whether it was safe for a patient with an abdominal aortic aneurysm (AAA) to have pulmonary function testing. My first thought was that it was probably unsafe but after a moment or two of thought I realized that I hadn’t reviewed the subject for a long time. When I checked the 2005 ATS/ERS general testing guidelines (there are no contraindications in the 2005 spirometry guidelines) I found that AAA wasn’t mentioned at all. In fact, the only absolute contraindication mentioned was that patients with a recent myocardial infarction (<1 month) should not be tested. Some relative contraindications were mentioned:

  • chest or abdominal pain
  • oral or facial pain
  • stress incontinence
  • dementia or confusional state

and activities that should be avoided prior to testing include:

  • smoking within 1 hour of testing
  • consuming alcohol within 4 hours of testing
  • performing vigorous exercise within 30 minutes of testing
  • wearing clothing that restricts the chest or abdomen
  • eating a large meal with 2 hours of testing

but these were factors where test results were likely to be suboptimal and not actually contraindications.

This got me curious since I thought that pulmonary function testing was contraindicated for more conditions than just an MI. I reviewed the 1994 and and then the 1987 ATS statements on spirometry but again found no mention of contraindications. Ditto on the 1993 ERS statement on spirometry and lung volumes. Finally, in the 1996 AARC clinical guidelines for spirometry I found a much longer list of contraindications:

  • hemoptysis of unknown origin
  • pneumothorax
  • recent mycardial infarction
  • recent pulmonary embolus
  • thoracic, abdominal or cerebral aneuysms
  • recent eye surgery
  • presence of an acute disease process that might interfere with test performance (e.g. nausea, vomiting)
  • recent surgery of thorax or abdomen

So where did the AARC’s list of contraindications come from? And why is there such a discrepancy between the ATS/ERS and the AARC guidelines?

Continue reading

2017 ERS DLNO standards

The European Respiratory Society has just published the first standards for DLNO testing. This is a signal that DLNO is moving from a research setting into routine clinical testing. Although it is unlikely that most PFT labs will immediately jump into DLNO testing, the standard is still interesting because of an extensive discussion of DLNO, DLCO, DMCO and Vc measurements and physiology. The DLNO standards (and their supplementary material) are open-access and can be downloaded from the European Respiratory Journal.

DLNO is performed in the same manner as a single-breath DLCO and it is specifically recommended that DLCO and DLNO tests be performed simultaneously. There are however, specific test system requirements based both on the properties of NO and on the two types of NO analyzers:

  • Nitric Oxide reacts with oxygen to form NO2 and at the levels used for DLNO testing (40-60 ppm) does so at a rate of approximately 1.2 ppm per minute. DLNO test gas is therefore usually stored as 400-1200 ppm NO in N2 and mixed into the DLCO test gas mixture (0.3% CO, 21% O2) ≤2 min before the DLCO/DLNO test. This would seem to require that the DLCO/DLNO test gas mixture to be held in a reservoir of some kind and to preclude the use of a demand valve but this was not specifically discussed. Because of uncertainties that occur when mixing the DLCO/DLNO gas mixture and in how long the mixture may be held in the reservoir the inspired NO concentration must also be measured immediately before the DLCO/DLNO test is performed.
  • The type of NO gas analyzer will determine how the expiratory gas concentrations are measured. Chemiluminescent analyzers usually have a response time on the order of ≤70 msec, and for these reasons can be used to perform a real-time analysis of exhaled air. Chemiluminescent analyzers are expensive however, and can add significantly to the cost of a test system. Electrochemical cells are significantly less expensive but have a response time on the order of 10 seconds and are therefore suitable only to test systems that mechanically collect an alveolar sample.

Continue reading

Some DLCO errors the 2017 standards will probably fix

Last week I ran across a couple errors in some DLCO tests that I don’t remember seeing before, or at least not as distinctly as they appeared this time. If I hadn’t been looking carefully I could have missed them but both sets of errors will be a lot more evident when the 2017 ERS/ATS DLCO standards are implemented.

The first error has to do with gas analyzer offsets. What alerted me was a set of irreproducible DLCO results.

Test 1: Test 2: Test 3: Test 4:
DLCO (ml/min/mmHg): 24.53 17.21 12.91 6.74
Inspired Volume: 1.99 2.06 2.32 2.26
VA (L): 3.83 3.52 3.63 2.60
Exhaled CH4: 43.27 49.19 54.80 74.14
Exhaled CO: 16.09 23.15 31.39 49.46

When I first looked at the graphs for each test, there wasn’t anything particularly evident until I pulled up the graph for the fourth DLCO test:

This graph showed that the baseline CH4 and CO readings were significantly elevated, but this hadn’t been evident in the previous tests.

Continue reading

Calculating VA the mass balance way

One of the more significant changes that appeared in the 2017 ERS/ATS DLCO standards was the requirement that rapid-response gas analyzer (RGA) systems calculate VA using a mass balance approach. This is actually more straightforward than it sounds but it does raise several issues that weren’t fully addressed in the 2017 standards.

Up until this time VA has been calculated from the inspired volume and by the amount of dilution of the tracer gas in the exhaled alveolar sample. Specifically:


Which is described by:

Where:

VI = inspired volume

Vd = Anatomical and Machine deadspace

Fitrace = Inspired tracer gas concentration

FAtrace = Exhaled tracer gas concentration

The basic concept behind the mass balance approach to measuring VA is relatively simple and is described in the 2017 standard as:

…the tracer gas left in the lung at end exhalation is equal to all of the tracer gas inhaled minus the tracer gas exhaled.”

Continue reading