ERS/ATS 2017 DLCO standards

The new ERS/ATS standards for DLCO testing were published in the January issue of the European Respiratory Journal. The article was published as open access and can be downloaded from the ERJ website.

The biggest difference between the new standards and those from 2005 is that they are now primarily oriented towards Rapid-response Gas Analyzers (RGA). The authors explicitly state that the new standards do not make older systems that use discrete alveolar sampling and slower gas analyzers obsolete, but many of the new suggestions and requirements for labs and manufacturers require systems with a RGA.

The differences between the 2017 and 2005 standards that I’ve been able to find include:

♦ Flow accuracy was not specified in the 2005 standard but is now required to be ± 2% over a range of ± 10 L/sec.

♦ Volume accuracy is now required to be ± 2.5% (± 75 ml) instead of ± 3.5%. Notably the 2005 standard included a ± 0.5% error in the calibrating syringe. The accuracy of the 3-liter syringe is now stated separately. In the 2005 standard volume accuracy was over an 8-liter range. No volume range is specified in the 2017 standard.

♦ RGA response time (analyzer rise time) had not previously been specified but is now required to be ≤150 milliseconds. Sample transit time was discussed but no specific recommendations were made. Sample transport issues such as Taylor dispersion, gas viscosity and turbulence at gas fittings was also discussed and although it was suggested that manufacturers attempt to minimize these effects no specific recommendations were made.

♦ Analyzer linearity for both RGA and discrete sample systems has been relaxed to ± 1.0% in the 2017 standards from ± 0.5% in the 2005 standards.

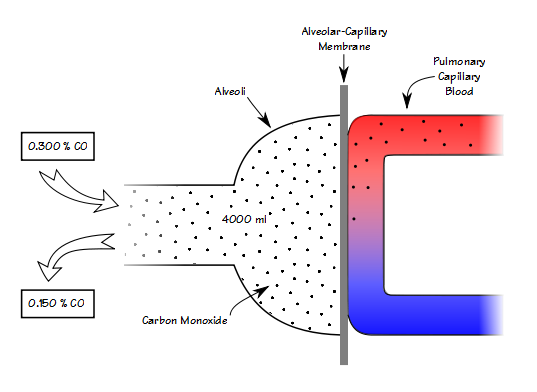
♦ CO analyzer accuracy for both RGA and discrete sample systems is now specified as ≤10 ppm (which is ±0.3% of 0.3% CO). It was previously specified as ± 0.0015% (which is ± 0.5% of 0.3% CO).

♦ Interference from CO2 and water vapor for both RGA and discrete sample systems is now specified as ≤10 ppm error in CO (when CO2 and water vapor are ≤5%). Interference was recognized as a problem in the 2005 standard but error limits were not specified.

♦ Digital sampling rate was not discussed or specified in the 2005 standards. It is now specified as a minimum of ≥100 hz with a resolution of 14 bits. A 1000 hz sampling rate is recommended.
Continue reading

The FVC/DLCO ratio. Will the real percent predicted please stand up?

Recently a reader asked me a question about the FVC/DLCO ratio. To be honest I’d never heard of this ratio before which got me intrigued so I spent some time researching it. What I found leaves me concerned that a lack of understanding about reference equations may invalidate several dozen interrelated studies published over the last two decades.

Strictly speaking the FVC/DLCO ratio is the %predicted FVC/%predicted DLCO ratio (which is usually abbreviated FVC%/DLCO%) and it appears to be used exclusively by specialists involved in the treatment of systemic sclerosis and related disorders. Specifically, the ratio is used to determine whether or not a patient has pulmonary hypertension. The basic idea is that (quoting from a letter to the editor):

“As we know, in ILD both FVC and DLCO fall and their fall is proportionate, whereas in pulmonary arterial hypertension DLCO falls significantly and disproportionately to FVC.”

A variety of algorithms using the FVC%/DLCO% have been devised. Inclusion factors are usually an FVC < 70% of predicted and a DLCO (corrected for hemoglobin) < 60% of predicted. A number of different threshold values for FVC%/DLCO% have been published ranging from 1.4 to 2.2 with the differences appearing to be dependent on study population characteristics and the type of statistical analysis performed. It is thought that individuals meeting the inclusion factors with an FVC%/DLCO% ratio above the threshold most probably have pulmonary hypertension.

Continue reading

Which DLCO should be reported?

I like to think my lab is better than most but every so often something comes along that makes me realize I’m probably only fooling my self.

Earlier this week I was reviewing the DLCO test data for a patient with interstitial lung disease. At first glance the spirometry and DLCO results pretty much matched the diagnosis and I had already seen they weren’t significantly different from the last visit. The technician had written “fair DLCO reproducibility” which was reason enough to review the test data but I’ve actually been making a point of taking a careful look at all DLCO tests, not just the questionable ones, for the last couple of weeks. I took one look at the test data, put my head in my hands, and counted to ten before continuing.

Reported: %Predicted: Test #1: Test #2: Test #3:
DLCO: 13.22 66% 10.08 92.17 16.36
Vinsp (L): 2.17 2.20 2.15
VA (L): 3.45 66% 2.89 2.93 4.02
DL/VA: 3.78 91% 3.49 31.5 4.07
CH4: 60.84 60.94 43.15
CO: 34.46 0.51 23.13

Even though the averaged DLCO results were similar to the last visit, the two tests they were averaged from were quite different. Reproducibility was not fair, it was poor. But far more than that, something was seriously wrong with the second test and the technician hadn’t told anybody that they’d had problems with the test system. {SIGH}. It’s awful hard to fix a problem when you don’t even know there is one in the first place.

I usually review reports in the morning the day after the tests have been performed, so the patient was long gone by the time I saw the results. This left me with a problem that I’m sure we’ve all had at one time or another and that was whether any of the DLCO results were reportable.
Continue reading

A change that probably isn’t a change

Recently a report came across my desk from a patient being seen in the Tracheomalacia Clinic. The clinic is jointly operated by Cardio-Thoracic Surgery and Interventional Pulmonology and among other things they stent airways. The patient had been stented several months ago and this was a follow-up visit. Given this I expected to see an improvement in spirometry, which had happened (not a given, BTW, some people’s airways do not tolerate stenting), but what I didn’t expect to see was a significant improvement in lung volumes and DLCO.

When I took a close look at the results however, it wasn’t clear to me that there really had been a change. Here’s the results from several months ago:

Observed: %Predicted: Predicted:
FVC: 1.19 50% 2.38
FEV1: 0.64 35% 1.79
FEV1/FVC: 53 71% 76
TLC: 3.21 76% 4.22
FRC: 2.34 96% 2.43
RV: 2.11 113% 1.85
RV/TLC: 66 150% 44
SVC: 1.15 48% 2.37
IC: 0.87 48% 1.80
ERV: 0.25 41% 0.58
DLCO: 6.59 38% 16.18
VA: 1.78 43% 4.12
IVC: 1.04

Change_that_isnt_change_2015_FVL_redacted_2

[more] Continue reading

A glitch in time

This relatively odd DLCO testing error came across my desk today. Although it’s fairly unusual it brings up some interesting points about how the Breath-Holding Time (BHT) is determined and what effect it has on DLCO.

Specifically, at the beginning of the DLCO test the patient took a partial breath in, then exhaled, then took a complete breath in. The patient performed the DLCO test three times and did exactly the same thing each time despite being coached by the technician to only take a single breath in. I’m sure this says something about human nature but I’m not exactly sure what.

BHT_Glitch_1

Anyway, our test systems uses the Jones-Meade approach to measuring breath-holding time (the ATS/ERS recommendation). The J-M algorithm starts the measurement of BHT when the inhalation has reached 1/3 of the inspiratory time. In this case the computer detected the beginning of the first inspiration and detected when the patient had reached the end of inspiration (which is standardized at the point at which 90% of the final inhaled volume has been reached), but it ignored what happened in the middle. For this reason, the software set the beginning of the breath-holding time before the “real” inhalation.

Continue reading

Assessing changes in DLCO

We have a number of patients who have spirometry and DLCO testing performed at regular intervals. I’ve noticed that every so often DLCO results change significantly without a change in spirometry (or lung volumes) or there’s a modest change in spirometry and a marked change in DLCO. I’ve been concerned that this may be a symptom of problems with our DLCO (CO/CH4) gas analyzers and at least once recently this kind of discrepancy did lead to having an analyzer being serviced. Realistically though, the gas analyzers are routinely passing their calibrations and when I look at the trends in calibration there hasn’t been any systematic drift. This doesn’t rule out intermittent problems however, so in order to find out whether these changes in DLCO are “real” or an artifact of our testing systems I decided to see if taking a closer look at the results would help resolve this.

First, what constitutes a significant change in DLCO?

My lab’s current working definition is an increase or decrease in DLCO that is 2.0 ml/min/mmHg or 10%, whichever is greater. This is slightly different from the ATS/ERS DLCO intra-session repeatability requirements (3.0 ml/min/mmHg or 10%) and may mean that we’re setting the bar too low but there’s a difference between intra-session and inter-session variability. Specifically, we average the two closest results (assuming there are at least two tests of good quality) from one testing session to another and it is the inter-session average we are comparing, not individual tests and for this reason we feel that a smaller change can be relevant.

Note: The ATS/ERS statement on interpretation does discuss inter-session DLCO variability but there it is expressed as >7% within the same day and >10% year to year without setting an upper limit. The year to year value is based solely on a study from 1989 on eight individuals using a manually operated testing system (Collins Modular Lung Analyzer) that used a semi-automated alveolar sampling bag and for this reason it’s hard to be sure it is still relevant.

Second, which test parameters have the greatest effect on calculated DLCO?

As a reminder, the DLCO formula is:

Continue reading

Hepatopulmonary syndrome

My hospital has an active liver transplantation program and all transplant candidates get a full panel of PFTs in my lab. The number of liver transplant candidates we get varies from week to week but probably averages between 150 and 200 a year. As with any population a certain number of them have COPD or other lung diseases but there are some that have normal spirometry and lung volumes but a reduced DLCO. This latter group of patients likely have hepatopulmonary syndrome (HPS).

There are three hallmarks of hepatopulmonary syndrome. First is the presence of a liver disease (most commonly cirrhosis and hepatitis although liver cancer can also be a cause). Second are intrapulmonary vascular dilations (usually determined by transthoracic contrast-enhanced echocardiography). The third are gas exchange abnormalities, which include hypoxia and a reduced DLCO. The more severe cases of HPS may also have some additional (and somewhat unusual) symptoms: platypnea (dyspnea induced by the upright position) and orthodeoxia (a decrease in PaO2 and SaO2 when changing from the supine to upright positions).

For reasons that aren’t completely clear liver disease can cause chronic vasodilation of the systemic and pulmonary vasculature. The normal diameter of the pulmonary capillaries is in the range of 8-15 microns. When dilated due to liver disease they can be as large as 100 or even 500 microns in diameter. This allows mixed-venous blood to pass through the pulmonary capillaries very quickly or even directly into the pulmonary veins, and this in turn causes arterial hypoxia.

HPS severity is usually graded according to the level of hypoxia. First, for HPS to be considered at all, an individual’s alveolar-arterial oxygen gradient (PAaO2) needs to be greater than 15 mm hg. After that HPS is graded using PaO2 (room air, sea level) as:

PaO2 (mm Hg)
Mild ≥80
Moderate <80, ≥60
Severe <60, ≥50
Very Severe <50

Interestingly CO2 retention is never seen in hepatopulmonary syndrome, and in fact since these individuals usually chronically hyperventilate, hypocapnia (PaCO2 < 35) and respiratory alkalosis are often present.
Continue reading

Adjusting DLCO for hemoglobin

My hospital’s Oncology division treats a number of patients with lymphoma and leukemia. It also has an active bone-marrow transplant program and for all of these patients diffusing capacity measurements are a critical part of assessing treatment progress. Since these patients are also frequently anemic, correcting DLCO results for hemoglobin is also critical.

For a factor that has as much importance for the interpretation of DLCO results as it does the effect of hemoglobin on DLCO has actually been studied a relatively small number of times. Part of the reason for this is the problem of finding an acceptable model. A reduced or elevated hemoglobin is a consequence of many diseases and conditions. When studying patients longitudinally it is often difficult to separate the changes in DLCO that occur from the disease process and those that occur from changes in hemoglobin. For this reason changes in hemoglobin pre- and post-treatment in anemia and polycythemia have been studied most frequently.

The ATS/ERS currently recommends correcting DLCO for hemoglobin (although notably they recommend that the predicted DLCO be corrected, not the observed value) using the equations developed by Cotes et al in 1972. Cotes’ work was based on subjects with iron-defficienty anemia but just as importantly on theoretical considerations involving Roughton and Forster’s equation on the relationship between the membrane and hemoglobin components of the diffusing capacity:

1_over_DLCO_formula

Cotes

Continue reading

DLNO isn’t the same as DMCO but sometimes it’s useful to pretend it (almost) is

Oxygen transport between the lungs and the body depends on numerous complex factors. Ventilation and the alveolar-capillary surface area are of course important but a critical component is hemoglobin. Oxygen is poorly soluble in water (which is what blood is mostly made of) and the transportation of oxygen throughout the body would not happen without hemoglobin’s ability to absorb and release oxygen on demand. Although it is possible to measure the diffusing capacity of oxygen (DLO2) the process is technically difficult and not at all suited to routine clinical testing.

There are a number of gases that are able to diffuse across the alveolar-capillary membrane and can be used in a variety of physiological measurements but in order for a particular gas to act as a substitute for oxygen it must be able to interact with hemoglobin. Carbon monoxide (CO) has an affinity for hemoglobin approximately 220 times greater than oxygen and was the first gas used to measure diffusing capacity (DLCO). DLCO has been a routine test for well over 50 years and has been measured by single-breath, steady-state and rebreathing techniques.

Nitric Oxide (NO) has an affinity for hemoglobin about 400 times greater than carbon monoxide (it is generally an irreversible process since the end product is methemoglobin whereas hemoglobin’s binding with CO is more reversible) and for this reason it can also be used to measure diffusing capacity. DLNO can also be measured by single-breath, steady-state and rebreathing techniques. Because of its high affinity and the speed at which the binding of NO to hemoglobin occurs numerous researchers have assumed that DLNO is equivalent to DMNO (the membrane component of diffusing capacity). This is not really true, but it can be a useful fiction and in order to understand why it’s necessary to look at the basic physiology of diffusing capacity tests.

Roughton and Forster’s seminal 1957 paper showed that diffusion is the sum of two resistances. I’ve discussed this previously but specifically:

1_over_DLCO_formula

Where:

DMCO = membrane component

θCO = the rate at which CO binds to hemoglobin

Vc = pulmonary capillary blood volume

The first resistance (1/DMCO) is the resistance to the diffusion of CO through the alveolar-capillary membrane and blood plasma to the surface of the stagnant plasma boundary layer around a red blood cell. The second resistance refers to the diffusion rate of CO through the plasma boundary layer, then the wall and interior of the red blood cell and finally the rate of reaction with hemoglobin.

DL_Resistances Continue reading

Using DL/VA (no, no, no, it’s really KCO!) to assess PFT results

Last week I was discussing the use of DL/VA to differentiate between the different causes of gas exchange defects with a physician. DL/VA is DLCO divided by the alveolar volume (VA). It is an often misunderstood value and the most frequent misconception is that it is a way to determine the amount of diffusing capacity per unit of lung volume (and therefore a way to “adjust” DLCO for lung volume). This is not the case because dividing DLCO by VA actually cancels VA out of the DLCO calculation and for this reason it is actually an index of the rate at which carbon monoxide disappears during breath-holding.

[Note: The value calculated from DLCO/VA is related to Krogh’s constant, K, and for this reason DL/VA is also known as KCO. The term DL/VA is misleading since the presence of ‘VA’ implies that DL/VA is related to a lung volume when in fact there is no volume involved. The use of the term DL/VA is probably a major contributor to the confusion surrounding this subject and for this reason it really should be banned and KCO substituted instead.]

I’ve written on this subject previously but based on several conversations I’ve had since then I don’t think the basic concepts are as clear as they should be.

DLCO_Model

When you know the volume of the lung that you’re measuring, then knowing the breath-holding time and the inspired and expired carbon monoxide concentrations allows you to calculate DLCO in ml/min/mmHg.  When you remove the volume of the lung from the equation however (which is what happens when you divide DLCO by VA), all you can measure is how quickly carbon monoxide decreases during breath-holding (KCO). 
Continue reading