The Lung Clearance Index (LCI) is a relatively simple test that provides a measure of ventilation inhomogeneity within the lung. This can be clinically useful information since several studies have shown that increases in LCI often precede decreases in FEV1 in cystic fibrosis and post-lung transplant. LCI results are only a general index into ventilation inhomegeneity however, and other than showing its presence, does not give any further information about its cause or location.
There is additional information that can be derived from an LCI test that can indicate the general anatomic location where ventilation inhomegeneity (or alternatively, ventilation heterogeneity) is occurring; specifically the conducting or acinar airways. This can be done because changes in the slope of the tidal N2 washout waveform during an LCI test are sensitive to the conduction-diffusion wavefront in the terminal bronchioles. Careful analysis of these slopes permits the derivation of two indexes; Scond, an index of the ventilation heterogeneity in the conducting airways; and Sacin, an index of ventilation heterogeneity the acinar airways.
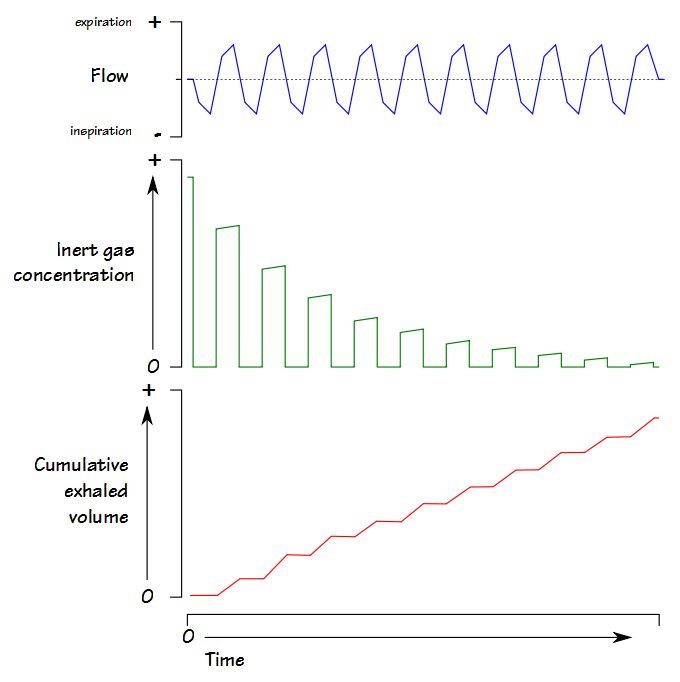
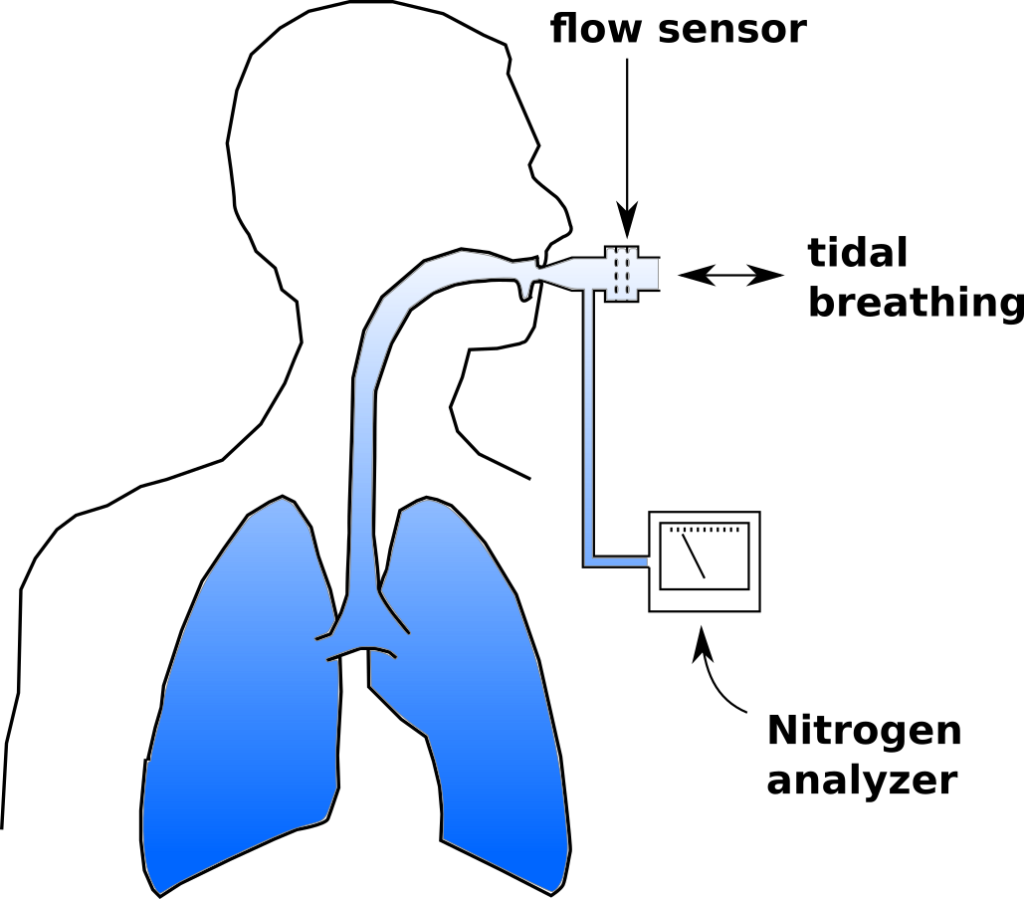
To review, an LCI test is a multi-breath nitrogen washout test. An individual is switched into a breathing circuit with 100% O2.
Once this happens tidal volume is measured continuously and used to determine the cumulative exhaled volume. Exhaled nitrogen is also measured continuously and is used to determine the cumulative exhaled nitrogen volume.  The LCI test continues until the end-tidal N2 concentration is 1/40th of what is was initially (nominally 2%). At that point FRC is calculated using the cumulative exhaled nitrogen volume:
FRC (L) = Exhaled N2 Volume / (Initial N2 Concentration – Final N2 concentration)
LCI is calculated by:
LCI = Cumulative Exhaled Volume (L) / FRC (L)
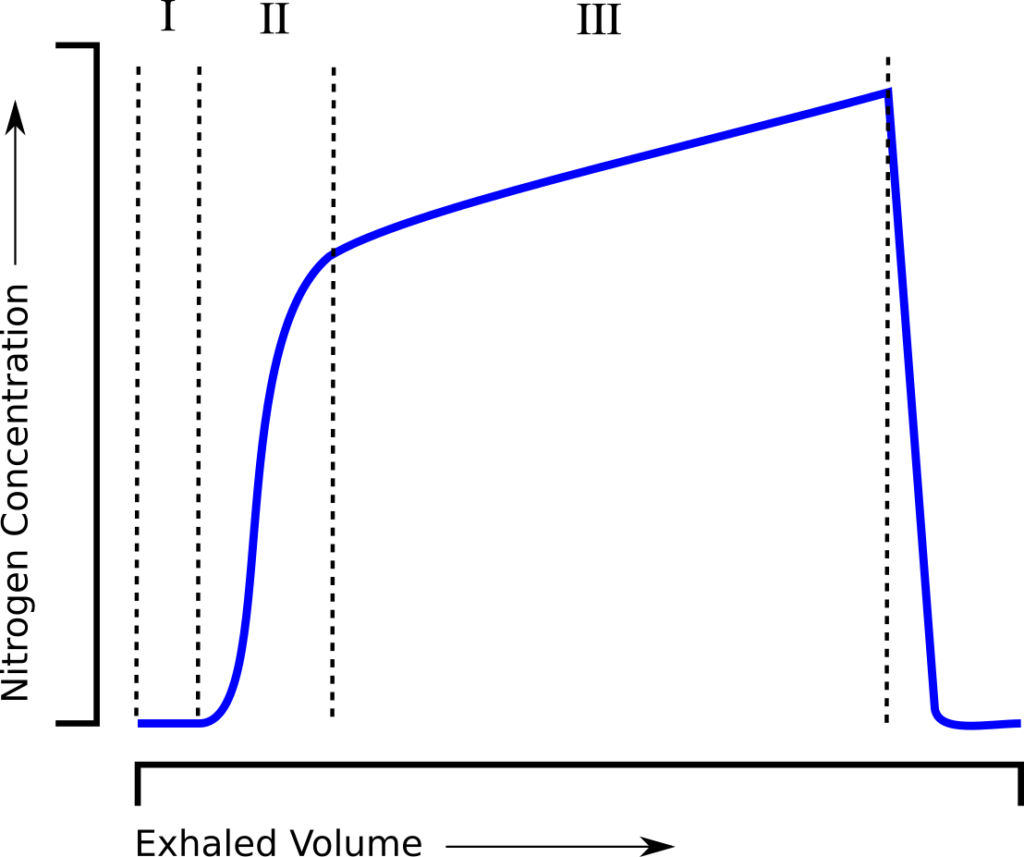
and is essentially a measure of how much ventilation is required to clear the FRC. When an individual tidal breath from the LCI test is graphed, it looks similar to a standard single-breath N2 washout:
and can be similarly subdivided into phase I (dead space washout), phase II (transition) and phase III (alveolar gas).


