Getting more out of the LCI with Scond and Sacin

The Lung Clearance Index (LCI) is a relatively simple test that provides a measure of ventilation inhomogeneity within the lung. This can be clinically useful information since several studies have shown that increases in LCI often precede decreases in FEV1 in cystic fibrosis and post-lung transplant. LCI results are only a general index into ventilation inhomegeneity however, and other than showing its presence, does not give any further information about its cause or location.

There is additional information that can be derived from an LCI test that can indicate the general anatomic location where ventilation inhomegeneity (or alternatively, ventilation heterogeneity) is occurring; specifically the conducting or acinar airways. This can be done because changes in the slope of the tidal N2 washout waveform during an LCI test are sensitive to the conduction-diffusion wavefront in the terminal bronchioles. Careful analysis of these slopes permits the derivation of two indexes; Scond, an index of the ventilation heterogeneity in the conducting airways; and Sacin, an index of ventilation heterogeneity the acinar airways.

To review, an LCI test is a multi-breath nitrogen washout test. An individual is switched into a breathing circuit with 100% O2.

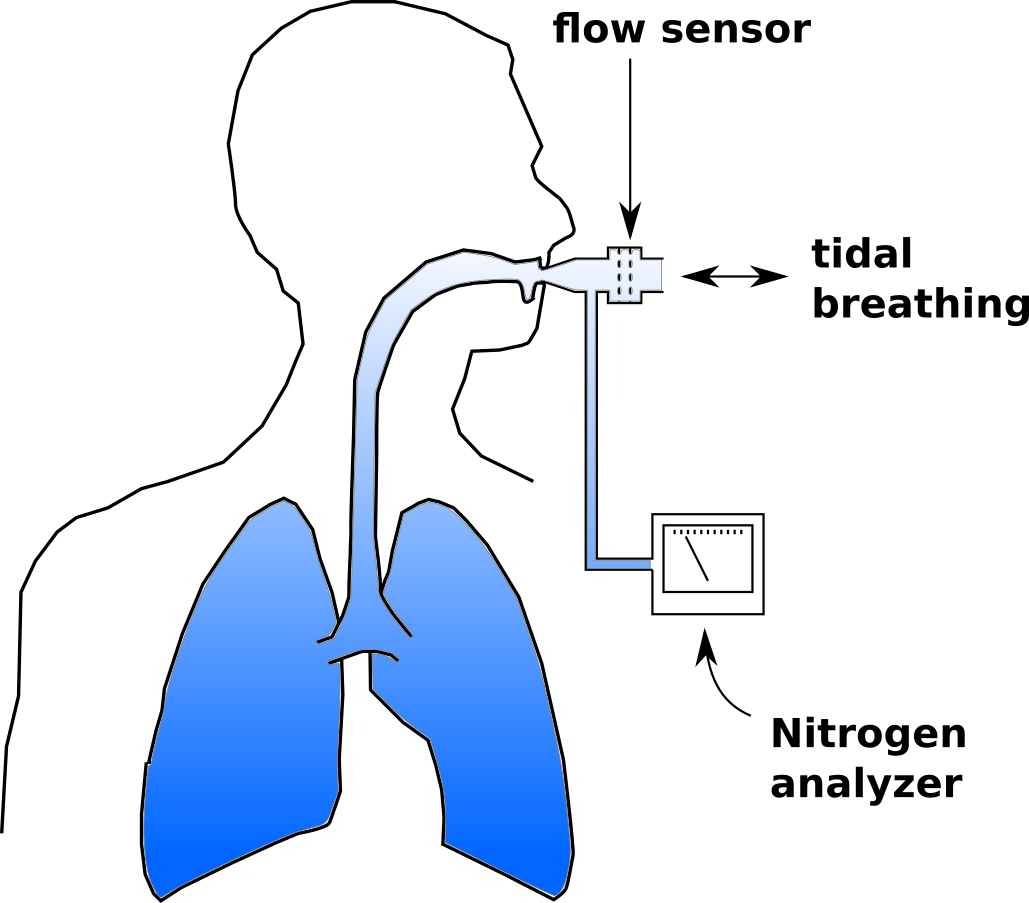
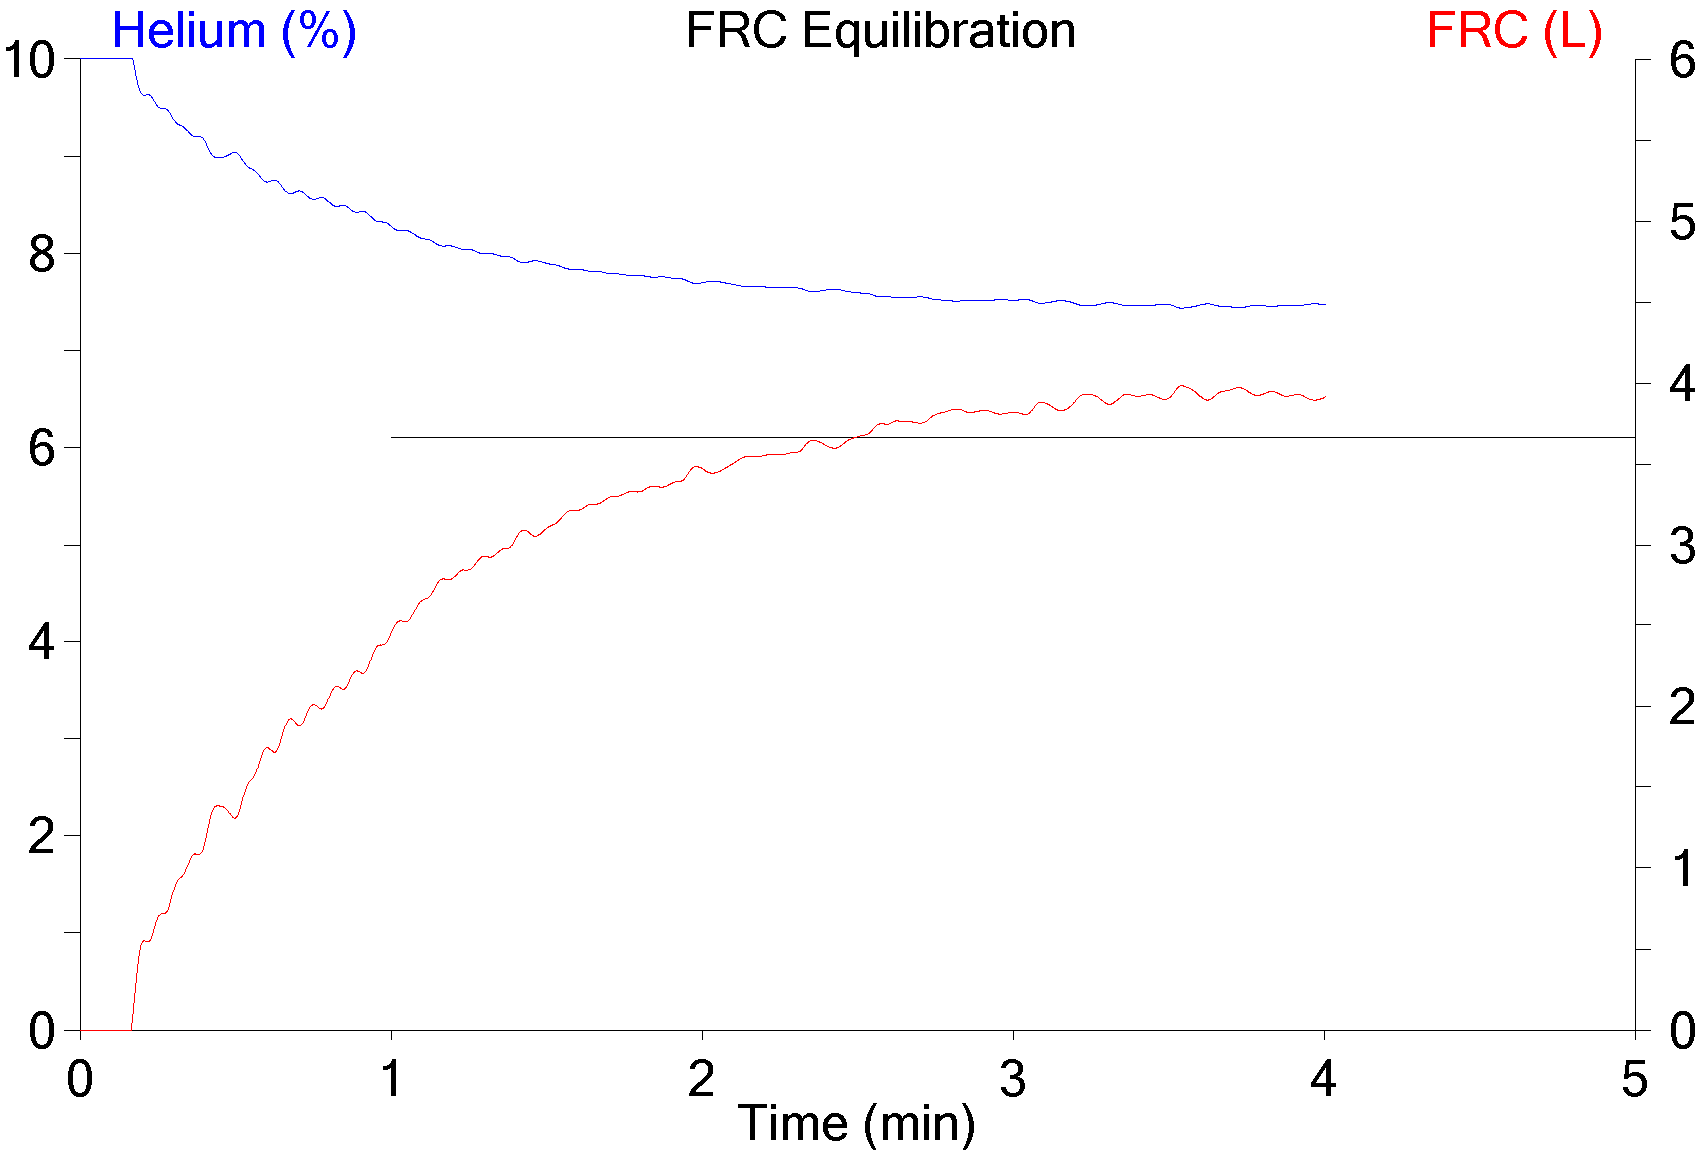
Once this happens tidal volume is measured continuously and used to determine the cumulative exhaled volume. Exhaled nitrogen is also measured continuously and is used to determine the cumulative exhaled nitrogen volume. 
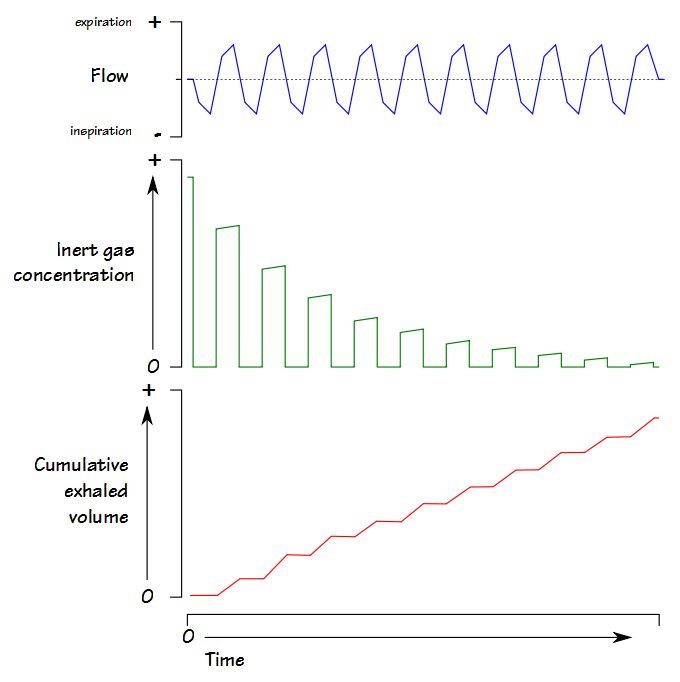
The LCI test continues until the end-tidal N2 concentration is 1/40th of what is was initially (nominally 2%). At that point FRC is calculated using the cumulative exhaled nitrogen volume:

FRC (L) = Exhaled N2 Volume / (Initial N2 Concentration – Final N2 concentration)

LCI is calculated by:

LCI = Cumulative Exhaled Volume (L) / FRC (L)

and is essentially a measure of how much ventilation is required to clear the FRC. When an individual tidal breath from the LCI test is graphed, it looks similar to a standard single-breath N2 washout:

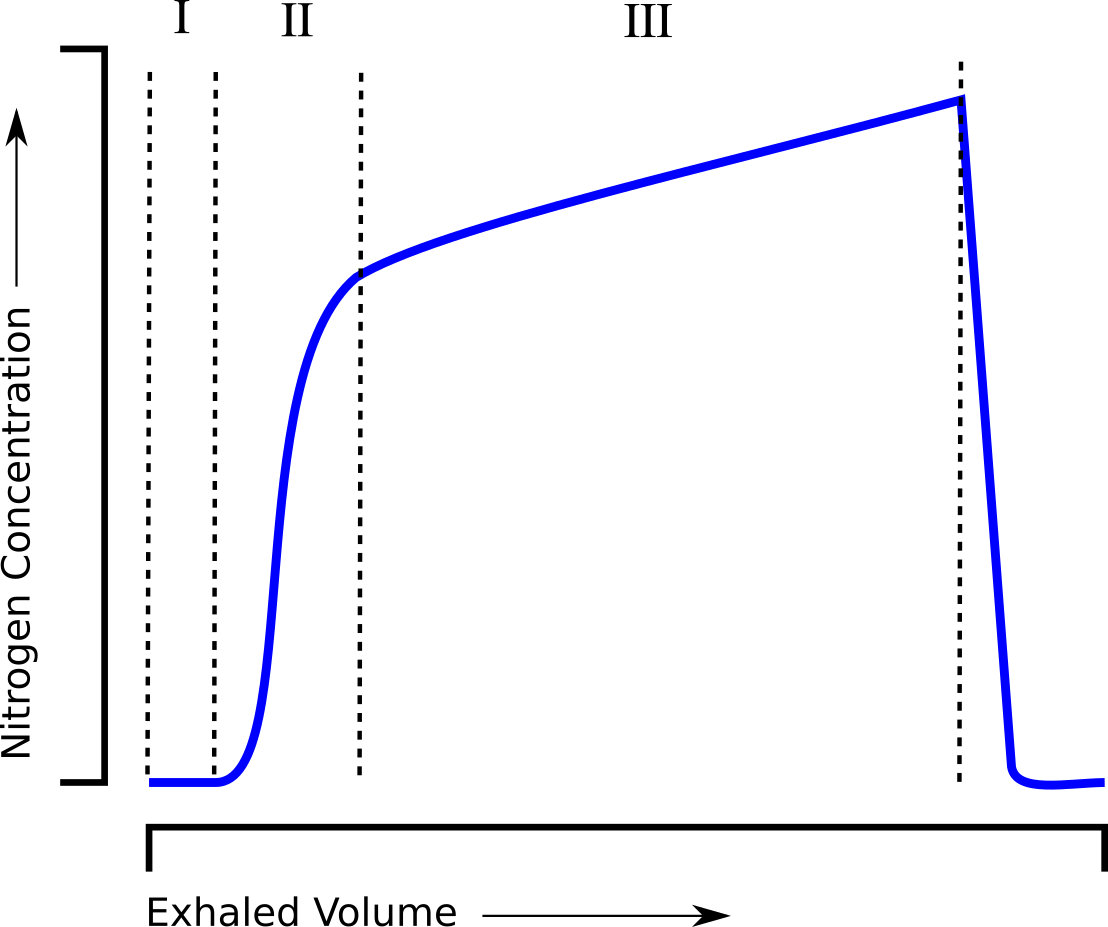
and can be similarly subdivided into phase I (dead space washout), phase II (transition) and phase III (alveolar gas).

Continue reading

Helium overshoot, revisited

A while back one of our technicians brought a helium dilution FRC graph to my attention and wanted to know if it showed a system leak. At that time my response was that it definitely wasn’t a leak (leaks don’t show increases in helium) and was probably due to too much oxygen being added to the system at the beginning of the test.

Helium_Overshoot_01

A couple of days ago a technician brought a similar graph to me and again I was asked why it looked unusual. I’ve had time to think about this issue since the last time and I’ve come up with an alternate explanation that I think fits the facts a bit better.

A normal helium dilution curve looks something like this:

Helium_Overshoot_02_nl-ish

which shows the helium decreasing with what is more or less an exponential decay curve. What’s unusual about the other curve is that it shows a relatively rapid fall to the lowest helium concentration near the beginning of the test and then a slow rise to the final concentration.

Continue reading

The VA/TLC ratio

I was reading James Hansen’s textbook on pulmonary function testing (one of my more interesting reads lately) and in passing he mentioned using the VA/TLC ratio as a way to measure ventilation inhomogeneity. The VA/TLC ratio has also been called the Va,eff/VA ratio and the VA’/VA ratio by different researchers but regardless of what it is called it is the ratio between a single-breath TLC measurement (VA) taken from a DLCO test and a multi-breath (helium dilution or N2 washout) or plethysmographic TLC.

A single-breath TLC regardless of whether helium, nitrogen, methane or argon is used tends to underestimate TLC even in individuals with normal lungs (and if the ratio > 1.0 then there is likely a technical problem with either the lung volume or DLCO measurements). This is mostly because of the limited time a single breath of tracer gas has to mix and diffuse evenly throughout the lungs. The idea is that a low VA/TLC ratio indicates poor gas mixing and therefore an elevated ventilation inhomogeneity.

The VA/TLC ratio is a relatively simple approach towards measuring ventilation inhomogeneity largely because the results can be derived from regular TLC and DLCO measurements. It was first proposed as a measurement over 40 years ago but despite having several notable proponents it has not achieved any particular level of acceptance.

Part of the reason for this may be that there is limited agreement about what a constitutes a normal VA/TLC ratio. Cotes et al suggest that the ratio decreases slightly with age and stated that the normal range is 0.9 to 1.0 at age 20 and 0.85 to 0.95 at age 60. Roberts et al, however, in a study with a reasonably large population (n=379) selected for the presence or absence of certain conditions (normal, asthma, COPD) found no particular correlation with age (or height, weight and gender) and stated that in individuals with normal FEV1/FVC ratios the LLN was 0.828. Punjabi et al in a retrospective study of 5369 individuals unselected except for the presence of acceptable test quality stated that for FEV1/FVC ratios above 0.70 the VA/TLC ratio was 0.98.

There is general agreement however, that the strongest correlation between TLC and VA is an individual’s FEV1/FVC ratio.

VA/TLC ratios from Burns et al.

The correlation between VA/TLC ratio and the FEV1/FVC ratio from Burns et al.

VA_TLC_Ratio_Formula_Burns

Continue reading

Multi-breath Washout and the Lung Clearance Index

The March 1, 2014 issue of the American Journal of Respiratory and Critical Care Medicine had an article on the use of the Lung Clearance Index (LCI) with bronchiectasis. The study showed that the LCI was as good as high-resolution computed tomography and more sensitive than FEV1 when assessing changes in airway status. This is one of the few articles I’ve seen on the LCI that was specifically about adults and wasn’t about cystic fibrosis.

So what is the LCI and how is it measured?

When lung tissue and airways are normal, inhaled gas is distributed evenly throughout the lung and the mixing and turnover of alveolar gas is relatively rapid. When airway obstruction is present gas distribution tends to becomes more uneven and the mixing and turnover takes longer. The Lung Clearance Index (LCI) is a way to measure these ventilation inhomogeneities and is basically a description of how much ventilation is required to completely clear the FRC. It was first described by Margaret Becklake in 1952 but has languished for many years. It has been revived in the last decade or so, particularly because it requires only tidal breathing which allows it to be measured in infants and children.

The measurement process is called an Inert Gas Multi-Breath Washout. It uses an open circuit and requires a tracer gas that is both inert and relatively insoluble and for these reasons has been primarily limited to helium, nitrogen and sulfur hexafluoride (SF6) although methane and argon could potentially be used as well.

Continue reading