A month or two ago in the AARC Diagnostics forum several members noted that their labs had acquired Impulse Oscillometry systems a number of years ago but that their physicians had since stopped ordering oscillometry tests, mostly because nobody understood what it was measuring and didn’t know how to interpret the results. There are a number of reasons why this is probably not an uncommon scenario and why, despite being first described in 1956, oscillometry is not used more widely.
But first, what is oscillometry, and what’s the best way to understand it?
Oscillometry refers to a closely related group of techniques for measuring respiratory impedance by superimposing small pressure waves on top of normal tidal breathing.

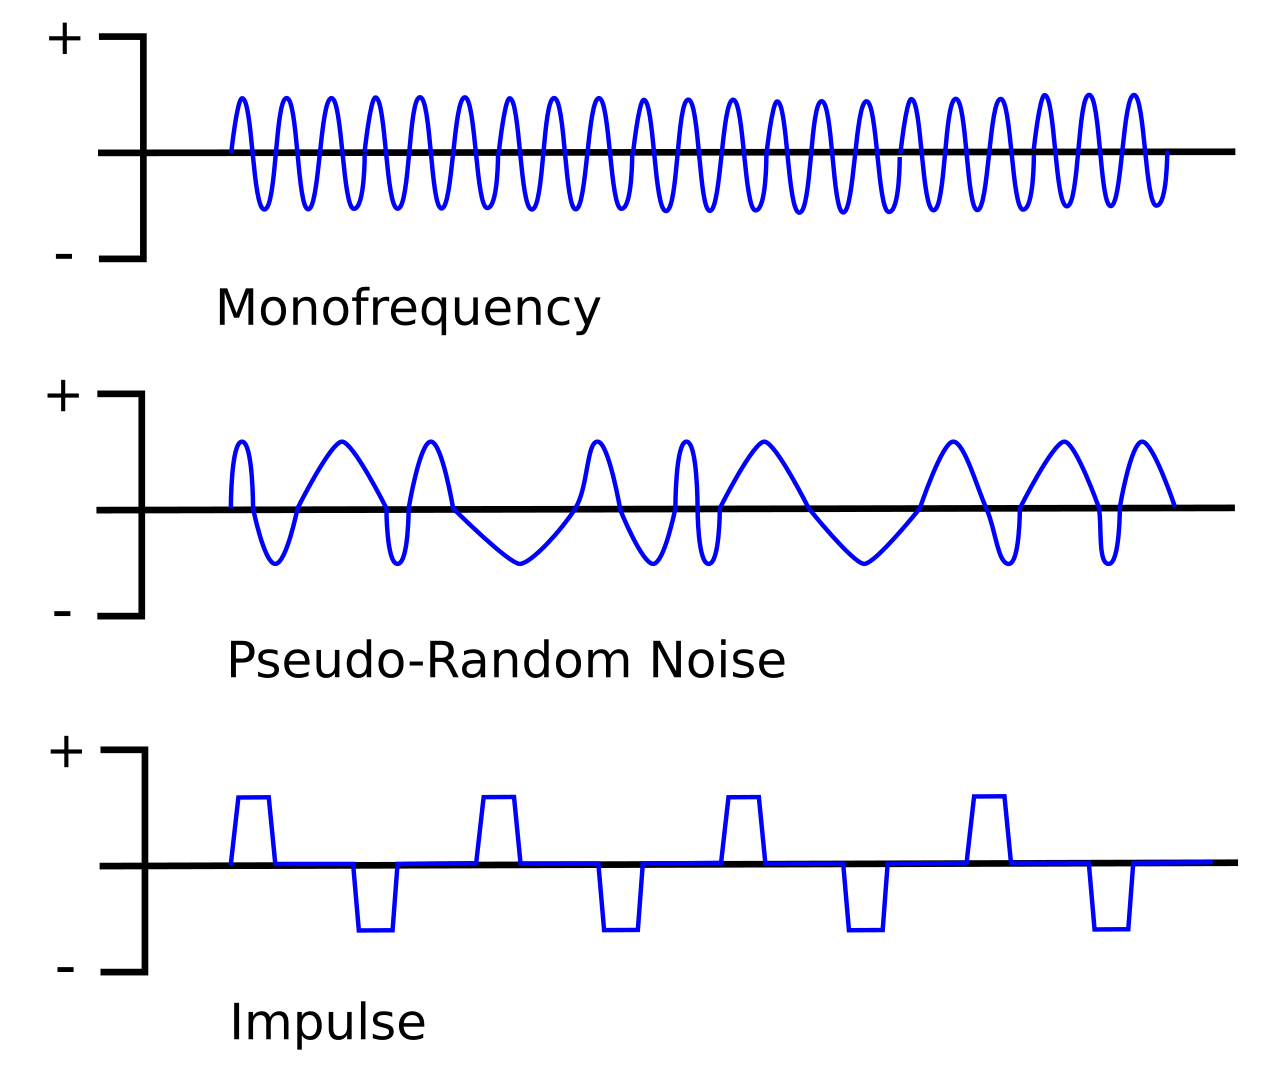
There are three main approaches: the Forced Oscillation Technique (FOT), which is sometimes used a blanket term for all oscillometry techniques but more often refers to a single frequency technique, Impulse Oscillometry (IOS) and Pseudo-Random Noise (PRN). Most commercial oscillometry systems use either PRN or IOS because each approach uses multiple oscillation frequencies more or less simultaneously which allows testing to performed relatively quickly. The mono-frequency technique is used mostly in research because although it is slow to scan all frequencies, it is able to resolve rapid changes occurring at a single frequency.
All techniques share a similar equipment configuration:

The oscillatory pressure is usually generated by a loudspeaker, although the actual waveform and the frequency it produces differ for each technique. The peak pressures are usually on the order of +/- 1 to 5 cm H2O (+/- 0.1 to 0.5 kPa). Because patients have to breathe during testing, the system provides a steady flow of fresh air in one manner or another but this has to include a low pass filter of some kind so that the pressure waveform is not significantly diverted or blunted. The key measurements are flow and the pressure at the mouth.
Oscillometry measures the impedance of the respiratory system, which is usually denoted as Zrs. Respiratory impedance has two components; resistance (Rrs) and reactance (Xrs). Reactance itself has two frequency-dependent components, capacitance and intertance.
Resistance more or less follows a standard formula:
![]()
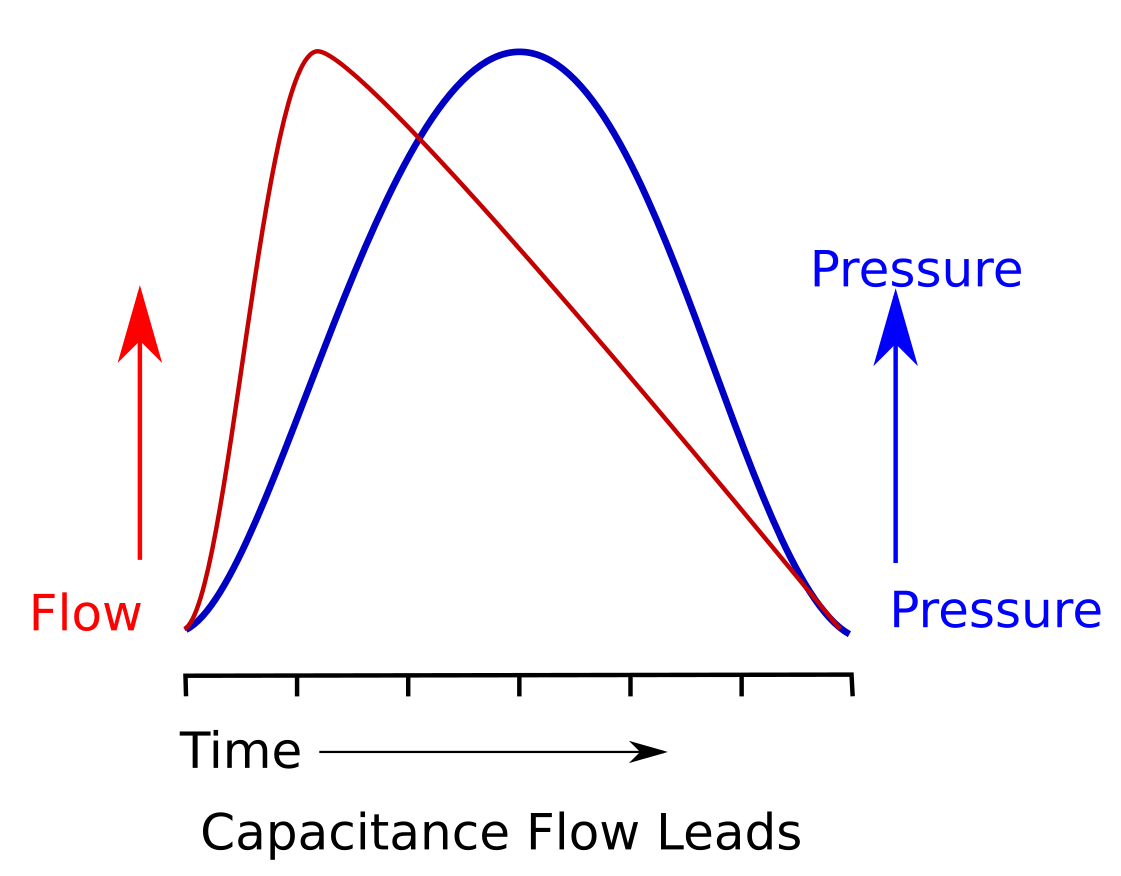
But this is also where it starts to get interesting (and complicated). When pressure is applied to the airway, there are two different ways that gas flow responds. This first is termed ‘capacitance’ and is primarily dependent on the elasticity the airways. To be clear, capacitance is not the same thing as compliance and this is one point where the oscillometric model of lung physiology diverges significantly from the traditional model.
When capacitance predominates airflow increases most rapidly at the beginning of the pressure change. As pressure continues to increase however, the rate of airflow actually decreases. A way to think about this is that the airways are acting like a spring. A spring has the least resistance to force when it is fully extended (relaxed) but its resistance increases as it is compressed.

So when a pressure is applied, flow is highest at the beginning and decreases over time.

What this means is that for capacitance, the flow waveform leads the pressure waveform.
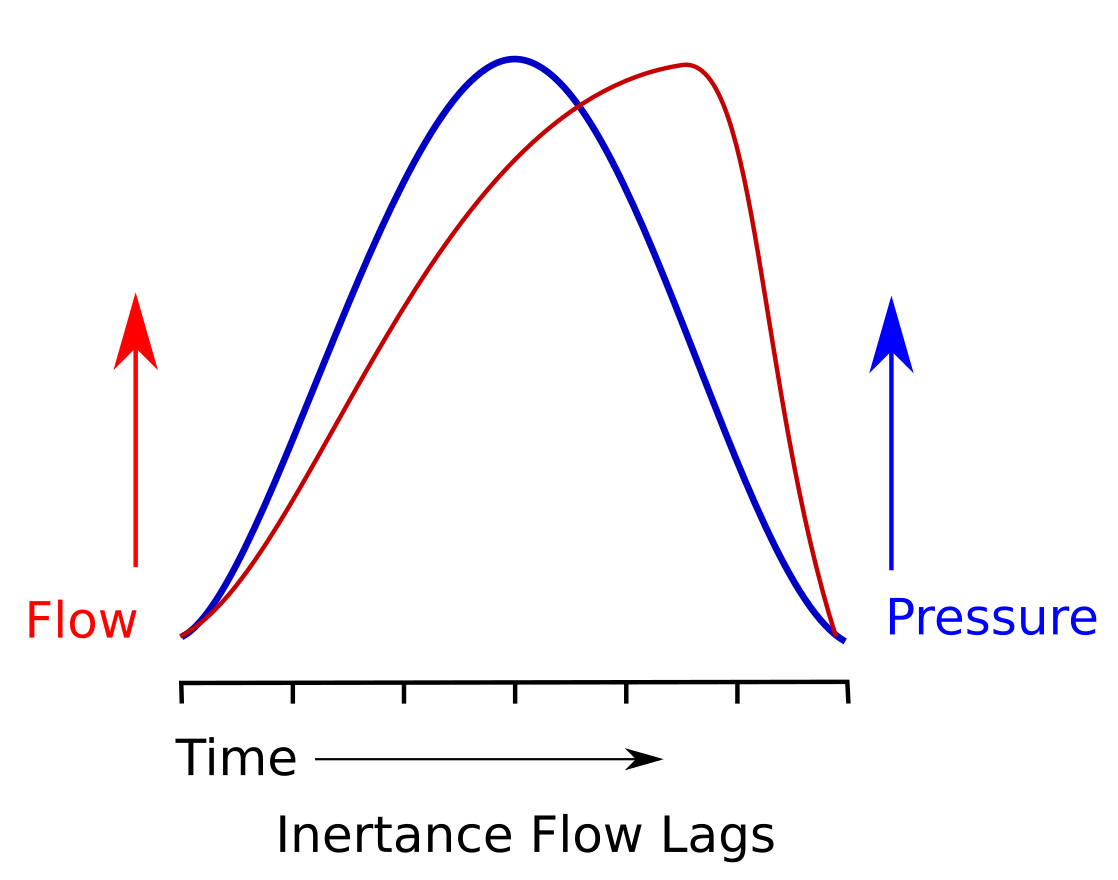
The second effect is termed ‘inertance’, and is primarily due to the inertia of air and the respiratory system. When inertance predominates airflow increases slowly at the beginning of a pressure change and becomes more rapid while the pressure continues. A way to think about this is that air is acting like a weight. A weight has the most resistance to force when it starts to move but its resistance decreases as its speed increases.

So when a pressure is applied, flow is lowest at the beginning and increases over time.

What this means is that for inertance, the flow waveform follows the pressure waveform.
Together, capacitance and inertance are the components that make up reactance, but how much each contributes to the total amount of reactance depends on the oscillation frequency. At low frequencies (very approximately 2 to 10 hz) capacitance effects tend to predominate. At high frequencies (very approximately 10 to 30 hz) inertance effects tend to predominate. By comparing the phase of the flow and pressure waveform (i.e. which leads and which lags), it is possible to determine which effect predominates. Very importantly, there is going to be a frequency where the capacitance and inertance effects are equal and this is going to be the resonant frequency (Fres).
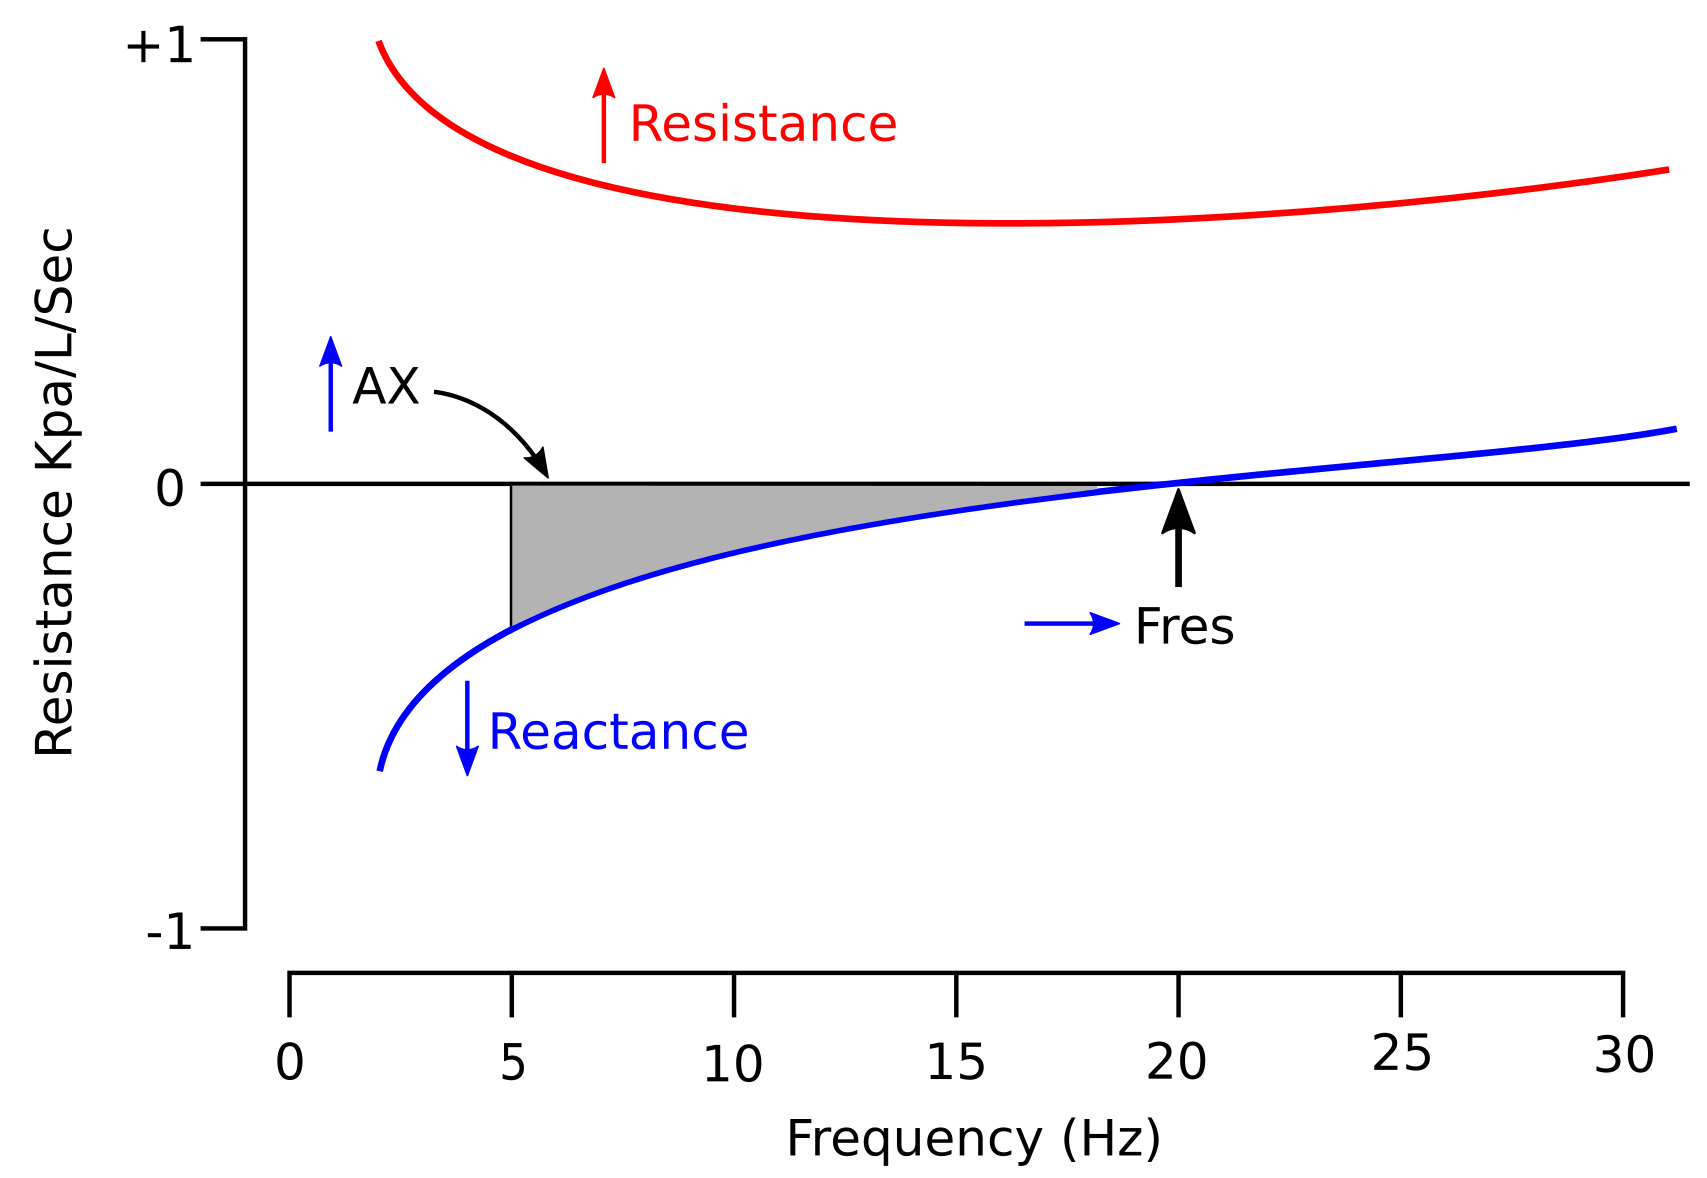
For mathematical reasons capacitance effects are reported as negative numbers and inertance as positive numbers, and they are also graphed that way. A typical airway resistance and reactance graph looks something like this:
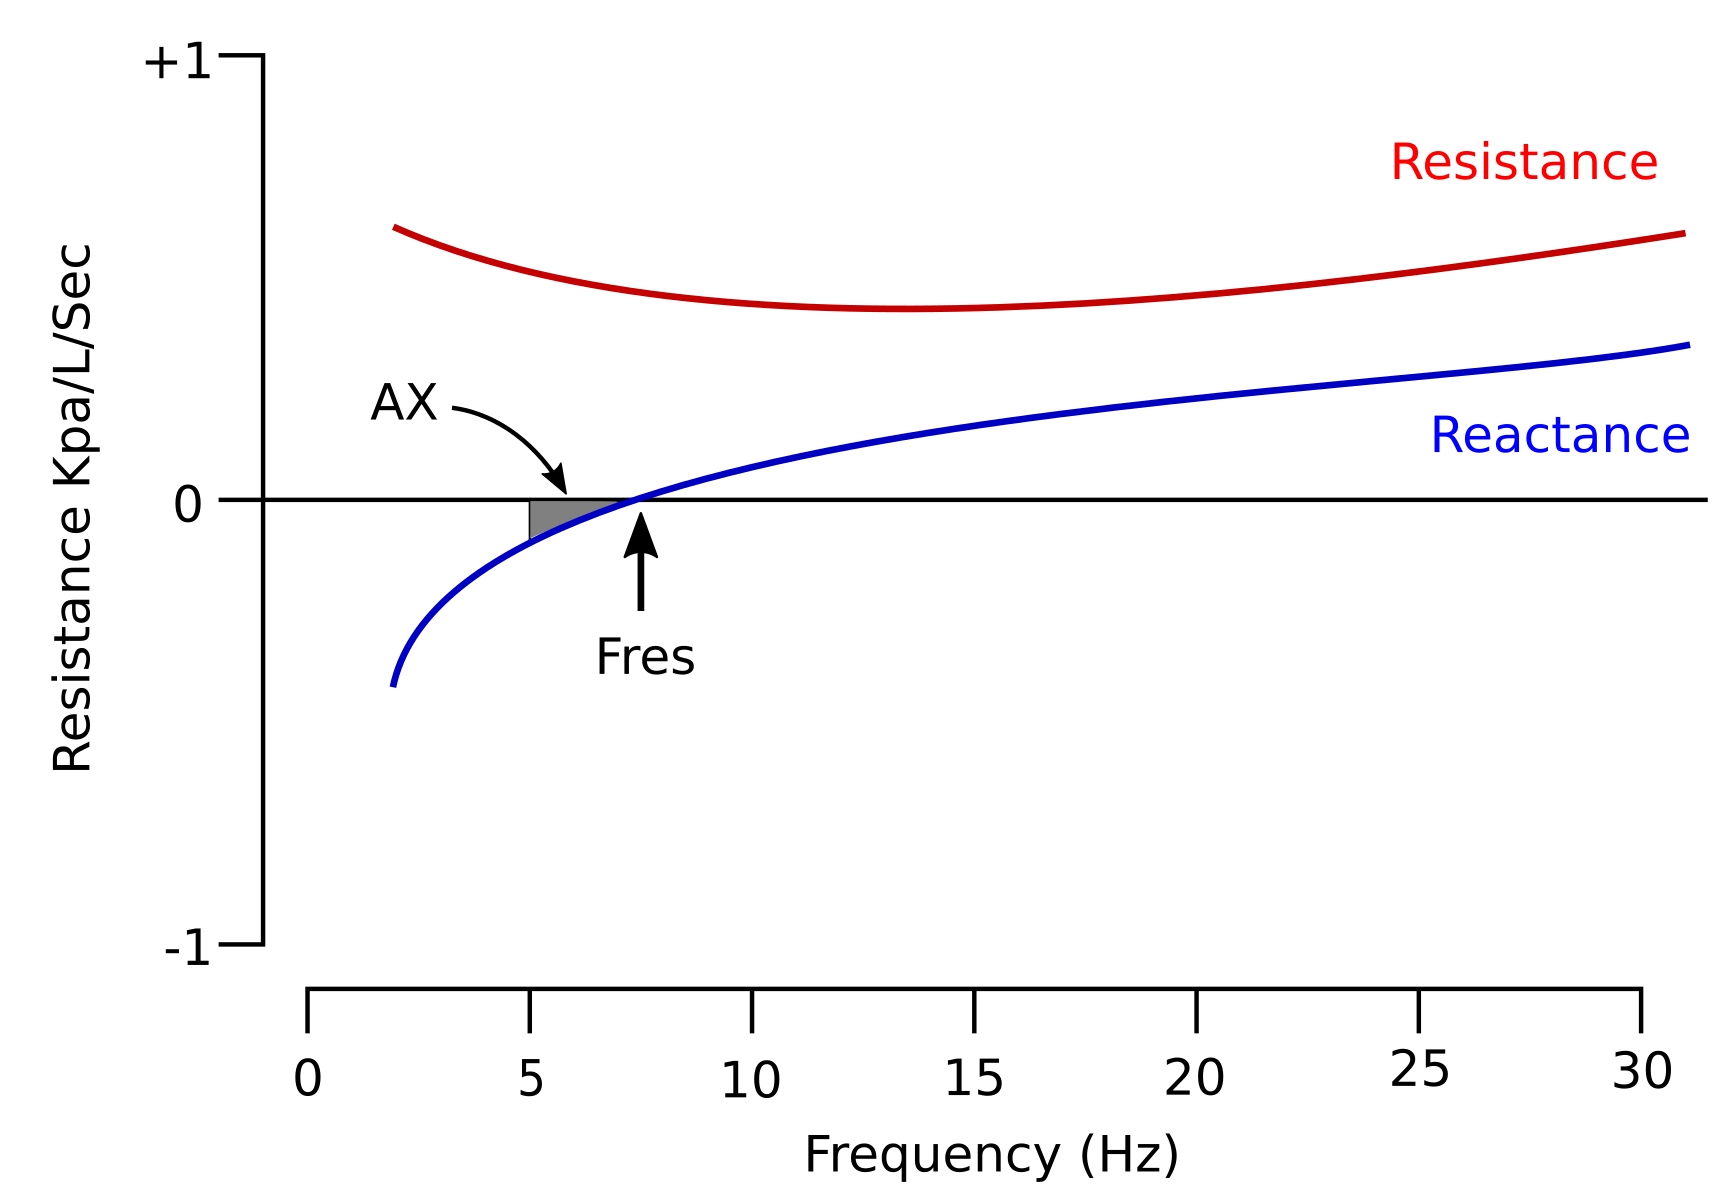
For both physiological and technical reasons oscillometry results are most often reported as the resistance and reactance at 5 hz (Rrs5, Xrs5), the resistance and reactance at 20 hz (Rrs20, Xrs20) and the resonant frequency (Fres), although the results from other frequencies can be reported as well.
In addition, the area bounded by a line at 5hz up to the resonant frequency can be determined. This is a measure of the magnitude of the frequencies where the elastic properties of the lung dominates (capacitance) dominates over inertance, and is reported as AX. Linear regression analysis can also be performed on the resistance and reactance waveforms and the slope of resistance, and the zero intercepts of resistance and reactance (i.e. what the resistance or reactance would have been at 0 hz) reported as Rrs(0), Rrs(1) and Xrs(0). Of these, Rrs(0) can be considered to be an index of airway obstruction while Rrs(1) is associated with respiratory system non-homogeneity. Subtracting Rrs20 from Rrs5 (Rrs5-Rrs20) also gives an approximate slope and is a value that is reported relatively frequently. Finally conductance, the inverse of Rrs(0), can be reported as Grs(0).
Although all oscillometry techniques produce similar results at least one study showed that IOS systematically produced produced a higher Rrs than did PRN and that the IOS Fres tended to be slightly higher than the PRN Fres.
Research has shown that higher oscillation frequencies are reflected from the larger airways and that lower frequencies travel more peripherally before returning to the mouth. This is because capacitance is primarily a property of the smaller airways and inertance a property of the larger airways. Disorders that reduce the elasticity of the lung, which includes both fibrosis and hyperinflation, causes the low frequency reactance to increase (become more negative). When airway obstruction increases there tends to be characteristic changes in resistance and reactance. Specifically, the reactance waveform shifts downward (more negative) which in turn causes the resonant frequency to increase. At the same time overall resistance increases but more so at low frequencies than at high frequencies.
Oscillometry is performed with the subject in a sitting position without crossed legs. The head and neck should be in a neutral or slightly extended position. The subject’s nose must be clipped and their hands need to firmly support their cheeks. Subjects should breathe quietly during testing and although some manufacturers claim that a test can be performed in as short as 8 seconds, tests more commonly last between 30 and 45 seconds. The reported impedence results are usually an average of measurements made during the testing period.
Software should reject individual measurements made during the transition from exhalation to inhalation or vice versa, since tidal flow is usually changing relatively rapidly at these times and this reduces the accuracy of superimposed pressure and flow waveform measurements. In addition, poor cheek support, leaks or artifacts like swallowing, glottis closure and tongue movement will also reduce measurement accuracy. For this reason Coherance, which is a value that reflects the reproducibility of the impedance measurements, should also be reported. A Coherance value <0.8 cm H2O at 5 hz or <0.9 cm H2O at 20 hz is an indication of suboptimal test quality.
The ability of oscillometry to distinguish between different lung disorders is the first area where some of its limitations start to appear. Specifically, there isn’t a significant difference in oscillometry results between interstitial lung diseases (ILD) and obstructive lung disease. In addition although there are differences between asthma and COPD, these tend to be subtle and are more associated with the severity of airway obstruction than with any specific differences between the two.
For both ILD’s and OVD’s the Rrs5, AX and Fres tend to be elevated and Xrs 5 decreased (more negative). One minor difference is that Rrs20 tends to be fairly normal in subjects with ILD but elevated in those with OVD. Nevertheless, oscillometry results for ILD overlap significantly with those of airway obstruction. This doesn’t mean that oscillometry can’t be used to monitor changes in subject with ILD over time, but there is little to differentiate ILD’s from OVD’s and for this reason oscillometry seems better suited for characterizing obstructive lung disorders than restrictive.
Oscillometry has probably been studied with asthma more often than any other lung disorder. Post-bronchodilator changes in oscillometry have been studied by numerous researchers and decreases in Rrs5 of between 30% and 40%, or an increase in Xrs5 of between 30% and 35% have been found to be significant. One study showed that showed an increase in Grs(0) of 10% correlated with an increase in FEV1 of 10%. Despite these findings however, there is no consensus as to what constitutes a positive bronchodilator response by oscillometry at this time.
Bronchoconstriction has also been studied by numerous researchers. Not surprisingly studies have shown that Rrs5, AX and Fres increased and Xrs5 decreased (became more negative) during exercise-induced bronchoconstriction. Another study showed that an increase of 50% in Rrs5 following hyperventilation bronchoprovocation correlated with a 20% decrease in FEV1.
In COPD, the magnitude of the changes in Fres, Rrs5, Rrs20, Xrs5 and AX tends to correlate well with GOLD1-GOLD4 severity.

Modified from DiMango AMGT, Lopes AJ, Jansen JM, Melo PL. Changes in respiratory mechanics with increasing degrees of airway obstruction in COPD: detection by forced oscillation technique. Respir Med 2006; 100: page 403.
When compared to asthma, patients with COPD tended to show a greater increase in Rrs5, particularly compared to Rrs20, and for this reason the Rrs5-Rrs20 is often more elevated in COPD.
In one study of obesity subjects showed the Rrs5, Rrs20 and Fres were increased significantly and Xrs5 was significantly decreased compared to subjects with normal body weight and that these changes tended to correlate with BMI. There were similar decreases in the same population in FVC and FEV1, also correlating with BMI (although they remained WNL) however the FEV1/FVC ratio did not change significantly.
Since oscillometry measurements are made relatively quickly and frequently during tidal breathing it is also possible to report resistance, reactance and the resonant frequency for both inspiration and expiration. This can be useful since several studies have shown that individuals with normal lungs have relatively little difference in Rrs5 and Xrs5 between inspiration and expiration, but those with airway obstruction such as COPD tend to show a significantly greater Rrs5 during expiration than during inspiration. Interestingly, one study showed that although Rrs5-Rrs20 was higher in subject with ILD than normal subjects, there was little difference between inspiration and expiration while subjects with asthma and COPD had relatively large changes in Rrs5-Rrs20 between inspiration and expiration.
Since oscillometry is frequently performed on children (there are probably more oscillometry research papers on children than adults) it’s important to note that there are a number of important differences that are present between children of the same age and changes that occur as children age. Specifically, numerous studies have shown that Rrs5, Rrs20 and Fres decrease and that Xrs5 increases (becomes less negative) with increasing height. The same set of changes (Rrs5, Rrs20 and Fres decrease and Xrs5 increases) with increasing age. This is most likely due to the normal increase in airway diameter and lung volume with increasing height and age.
So why isn’t oscillometry used more frequently?
One of the major reasons that oscillometry can be difficult to understand and this is because the terminology and underlying concepts of oscillometry are usually presented in the same terms as those that are used in electrical engineering. This is not accidental since the physical responses of the respiratory system to oscillation matches the equations that describe simple electrical circuits. On the plus side, this type of circuitry is well understood and this means that there are many mathematical tools available for analyzing test data. On the minus side however, these equations require a relatively advanced knowledge of mathematics and although the underlying physiological concepts can be easily modeled in terms of resistors, capacitors and inductors, they do not map at all well onto the standard concepts and terminology of pulmonary physiology.
Note: I’d also have to say that those who actually do understand the mathematics and concepts of oscillometry have done exceedingly little to bridge the gap with those that don’t. As an example I was reading a monograph on oscillometry which ostensibly was intended as a basic primer on the subject and equation sets like this:
![]()
![]()
![]()
were presented throughout, but without any explanation whatsoever of the terms used or what they or the equation represented. The obvious presumption was that you already had to understand the math in order to understand the math!
I will also mention that because the Xrs at low frequencies is negative discussions of changes in Xrs can be somewhat confusing. Too often authors interchangeably use increase and decrease to mean the same thing (i.e. that Xrs has become more negative) and this makes it necessary to read study results carefully.
There is also the fact that there is only fair correlation at best between traditional pulmonary function tests and values obtained from oscillometry. Research has shown there are occasionally statistically significant associations between certain oscillometry values and values such as FEV1, PEF, TLC and DLCO but this shouldn’t be taken to mean there is a correlation. Given the fact that oscillometry and spirometry are measuring completely different things this shouldn’t be surprising, but it has been an additional barrier against acceptance.
There are also a limited number of reference equations and the differences in predicted values are occasionally large. One study of oscillometry that derived reference equations from an elderly population compared its results to the reference equations from a couple prior studies and found up to a 29% difference in Rrs5, up to a 33% difference in Rrs20 and up to a 76% difference in Xrs5. Since numerous studies compare their results to predicted values this opens the interpretation of their results to question.
Much of the interpretation of oscillometry results, particularly when differentiating between different lung disorders, relies less on predicted values and more on the patterns of resistance and reactance. These patterns are occasionally distinct, but recognizing them requires practice and they are hard to pin down from reference equations alone. An additional limiting factor is that the diagnostic ability of oscillometry is questionable due to the overlap between diseases like ILD, COPD and asthma. This probably makes oscillometry better suited to monitoring changes over time, in particular for assessing bronchodilation and bronchoconstriction even though there is no clear consensus as to what constitutes a significant change.
I also have some concerns about the measurements associated with oscillometry. Although values like Rrs5, Rrs20 and Xrs5 do seem to reflect their specific parts of the Rrs and Xrs spectrums, they are arbitrary choices. I’ve seen no research that indicates that the values from these specific frequencies are in any way optimum. In addition, linear regression is used to analyze the slope and intercept of the Rrs and Xrs frequency spectrums but since these spectrums are usually curves, how accurate, reproducible and meaningful are Rrs(0), Rrs(1) and Xrs(0)?
Finally, although it is possible to calibrate the flow and pressure sensors of a given oscillometry system results from oscillometry systems are highly dependent on the software used to analyze the raw data. The 2003 ERS recommendations for oscillometry includes some suggestions for software algorithms but it’s not possible to determine whether or not these are actually followed, and depending on the technology being used, even whether it is even appropriate to do so. I’m not suggesting that oscillometry systems are inaccurate, since it’s my experience that most manufacturers try to design systems that produce accurate measurements, but at the same time there are no real standards for assessing oscillometer accuracy. For these reasons I think it past time that the 2003 ERS recommendations were updated.
The main advantages of oscillometry is that little patient cooperation, other than the ability to breathe on a mouthpiece with a noseclip, is needed (and even then it has also been adapted for use in intubated patients receiving mechanical ventilation). This means that measurements can be made on any individual that might have difficulty with traditional tests, which in particular includes children, but also adults that are otherwise unable to perform spirometry or are medically contraindicated from doing so.
Spirometry and oscillometry each have their own strengths and weaknesses. There are indications that oscillometry may be more sensitive to the smaller, more peripheral airways than spirometry. There are indications that because inhalation to TLC can reverse bronchoconstriction oscillometry may be superior to spirometry for challenge testing. Oscillometry’s primary utility however, appears to lie mostly in its ability to obtain clinically useful measurements from individuals that are otherwise unable to perform routine spirometry. Oscillometry isn’t a replacement for spirometry but it can still be a useful adjunct.
References:
de Albuquerque CG, de Andrade FMD, de Almeida Rocha MA, de Oliviera AFF, Ladosky A, Victor EG, Rizzo Ja. Determining respiratory system resistance by impulse oscillometry in obese individuals. J Bras Pneumol 2015; 41(55): 422-426
de Assumpcion MS, Goncalves RM, Martins R, Bobbio TG, Schivinski CIS. Reference equations for impulse oscillomtry system parameters for in healthy Brazilian children and adolescents. Respir Care 2016; 61(8): 1090-1099.
Baswa S, Diong B, Nazeran H, Goldman M. Respiratory system models based on parameter estimates from impulse oscillometry data. Proceedings of the 2005 IEEE, Engineering in medicine and biology, 27th annual conference. Pages 2958-2961.
Bickel S, Popler J, Lesnick B, Eid N. Impulse oscillometry. Interpretation and practical applications. Chest 2014; 146(3): 841-847.
Bikov A, Pride, NB, Goldman MD, Hull JH, Horvath I, Barnes PJ, Usmani OS, Paredi P. Glottal aperature and buccal airflow leaks critically affect forced oscillometry measurements. Chest 2015; 148(3): 731-738.
Brashier B, Salvi S. Measuring lung function using sound waves: role of the forced oscillation technique and impulse oscillometry system. Breathe 2015; 11(1): 57-65.
Crim C, Celli B, Edwards LD, Wouters E, Coxson HO, Tal-Singer R, Calverly PMA. Respiratory system impedance with impulse oscillometry in healthy and COPD subjects: ECLIPSE baseline results. Respir Med 2011; 105: 1069-1078.
DiMango AMGT, Lopes AJ, Jansen JM, Melo PL. Changes in respiratory mechanics with increasing degrees of airway obstruciton in COPD: detection by forced oscillation technique. Respir Med 2006; 100: 399-410.
Evans TM, Rundell KW, Beck KC, Levine AM, Baumann JM. Airway narrowing measured by spirometry and impulse oscillomtry following room temperature and cold temperature exercise. Chest 2005; 128(4): 2412-2419.
Galetke W, Randerath WJ, Feler C, Muth T, Borsch-Galetke E. Esophageal pressure method and impulse oscillometry to assess mechanical properties of the respiratory system in health men. Med Sci Monit 2009; 15(8): CR429-435.
Grimby G, Takishima T, Graham W, Macklem P, Mead J. Frequency dependence of flow resistance in patients with obstructive lung disease. J Clin Invest 1968; 47(6): 1455-1465.
Guan WJ, Yuan JJ, Gao YH, Li HM, Zheng JP, Chen RC, Zhong NS. Impulse oscillometry and spirometry small airway parameters in mild to moderate bronchiectasis. Respir Care 2016; 61(11): 1513-1522.
Hellinckx J, Cauberghs M, De Boeck K, Demedts M. Evaluation of impulse oscillation system: comparison with forced oscillation technique and body plethysmography. Eur Respir J 2001; 18: 564-570.
Houghton CM, Woodcock AA, Singh D. A comparison of plethysmography, spirometry and oscillometry for assessing the pulmonary effects of inhaled ipratropium bromide in health subjects and patients with asthma. Brit J Clin Pharmacol 2004; 59(2): 152-159.
Kolsum U, Borrill Z, Roy K, Starkey C, Vestbo J, Houghton C, Singh D. Impulse oscillometry in COPD: identification of measurements related to airway obstruction, airway conductance and lung volumes. Respir Med 2009; 103: 136-143.
Mansur AH, Manney S, Ayres JG. Methacoline-induced asthma symptoms correlate with impulse oscillometry but not spirometry. Respir Med 2008; 102: 42-49.
van Noord JA, Clement J, Cauberghs M, Mertens I, Van de Woestijne KP, Demedts M. Total respiratory resistance and reactance in patients with diffuse interstitial lung disease. Eur Respir J 1989; 2: 846-852.
Ohishi J, Kurosawa H, Ogawa H, Irokawa T, Hida W, Kohzuki M. Application of impulse oscillomtry for within-breath analysis in patients with chronic obstructive pulmonary disease: pilot study. BMJ Open 2011; 2: e000184.
Oostveen E, MacLeod D, Lorino H, Farre R, Hantos Z, Desager K, Marchal F. ERS Task Force. The forced oscillation technique in clinical practice: methodology, recommendations and future developments. Eur Respir J 2003; 22: 1026-1041.
Oostveen R, Boda K, van der Grinten CPM, James AL, Young S, Nieland H, Hantos Z. Respiratory impedance in healthy subjects: baseline values and bronchodilator response. Eur Respir J 2013; 42: 1513-1521
Pasker HG, Schepers R, Clement J, van de Woestijne KP. Total respiratory impedance measured by means of the forced oscillation technique in subjects with and without respiratory complaints. Eur Respir J 1996; 9: 131-139.
Schulz H, Flexeder C, Behr J, Heier M, Holle R, Huber RM, Jorres RA, Nowak A, Peters D, Wichmann HE, Heinrich J, Karrasch S. Reference values for impulse oscillometric lung function indices in adults of advanced age. PlosOne 8(5): e63366.
Smith HJ, Reinhold P, Goldman MD. Forced oscillation technique and impulse oscillometry. Eur Respir Mon 2005; 31: 72-105
Sugiyama A, Hattori N, Haruta Y, Nakamura I, Nakagawa M, Miyamoto S, Onari Y, Iwamoto H, Ishikawa N, Fujitaka K, Murai H, Kohno N. Characteristics of inspiratory reactance in interstitial lung disease. Respir Med 2013; 107: 875-882.
Zerah F, Lorino AM, Lorino H, Harf A, Macquin-Mavier I. Forced oscillation technique vs spirometry to assess bronchodilation with asthma and COPD. Chest 1995; 108: 41-47

PFT Blog by Richard Johnston is licensed under a Creative Commons Attribution-NonCommercial 4.0 International License
Hi Richard,
I’m a respiratory scientist and a big fan of your blog as it has helped me understand many aspects of respiratory function testing that i have found hard to understand. Although it may seem easy to perform such manouvers as spirometry and diffusing capacity, learning everything behind the testing is whole another world!
I was wondering if you had any links or books that would help me further understand FOT technology? I have tried reading many sources regarding this but the electrical engineering terminology always seems to put me off.
Regards
Oliver –
I had the same problem trying to do the research for the posting. I was unable to find any intermediate-level literature and the few oscillometry-for-dummies articles I found were still pretty dense with math. I have a background in electronics so to some extent I understand what they were trying to explain but even so much of the math is beyond me. Unfortunately, if you want to get into FOT you’ve got to deal with the math and terminology.
– Richard