The Lung Clearance Index (LCI) is a relatively simple test that provides a measure of ventilation inhomogeneity within the lung. This can be clinically useful information since several studies have shown that increases in LCI often precede decreases in FEV1 in cystic fibrosis and post-lung transplant. LCI results are only a general index into ventilation inhomegeneity however, and other than showing its presence, does not give any further information about its cause or location.
There is additional information that can be derived from an LCI test that can indicate the general anatomic location where ventilation inhomegeneity (or alternatively, ventilation heterogeneity) is occurring; specifically the conducting or acinar airways. This can be done because changes in the slope of the tidal N2 washout waveform during an LCI test are sensitive to the conduction-diffusion wavefront in the terminal bronchioles. Careful analysis of these slopes permits the derivation of two indexes; Scond, an index of the ventilation heterogeneity in the conducting airways; and Sacin, an index of ventilation heterogeneity the acinar airways.
To review, an LCI test is a multi-breath nitrogen washout test. An individual is switched into a breathing circuit with 100% O2.
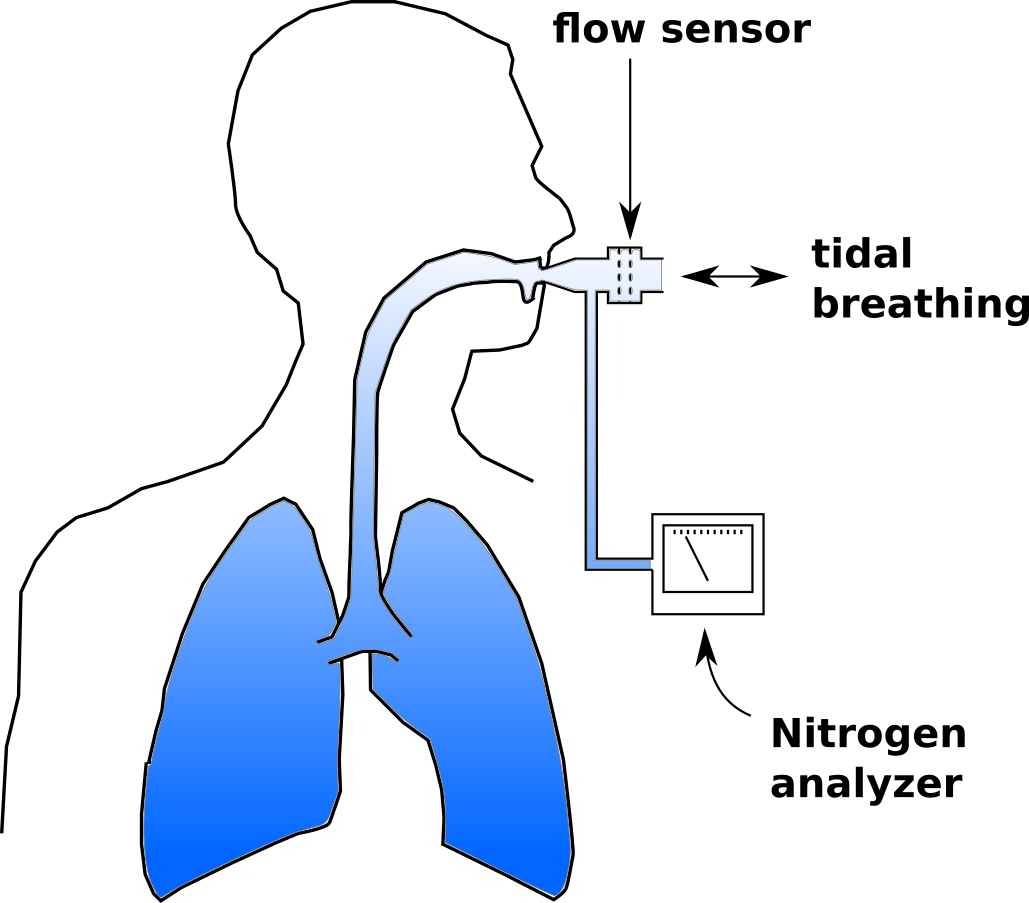
Once this happens tidal volume is measured continuously and used to determine the cumulative exhaled volume. Exhaled nitrogen is also measured continuously and is used to determine the cumulative exhaled nitrogen volume. 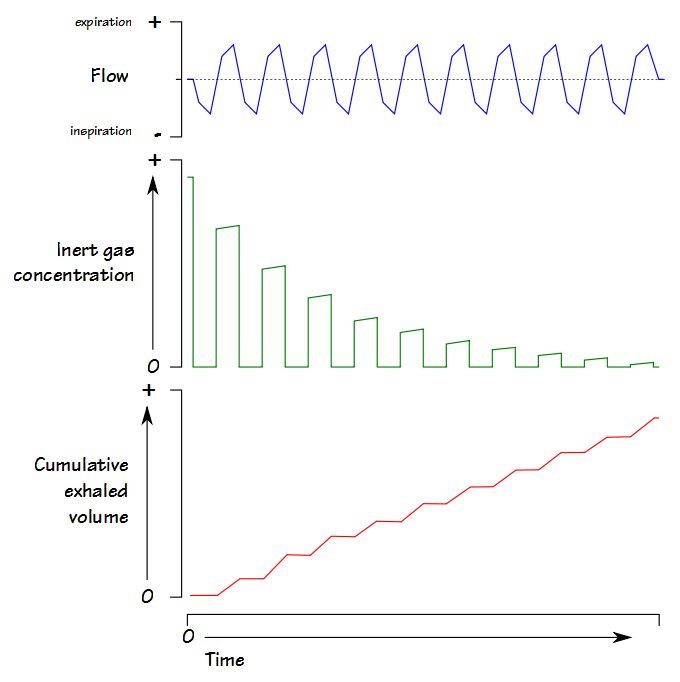 The LCI test continues until the end-tidal N2 concentration is 1/40th of what is was initially (nominally 2%). At that point FRC is calculated using the cumulative exhaled nitrogen volume:
FRC (L) = Exhaled N2 Volume / (Initial N2 Concentration – Final N2 concentration)
LCI is calculated by:
LCI = Cumulative Exhaled Volume (L) / FRC (L)
and is essentially a measure of how much ventilation is required to clear the FRC. When an individual tidal breath from the LCI test is graphed, it looks similar to a standard single-breath N2 washout:
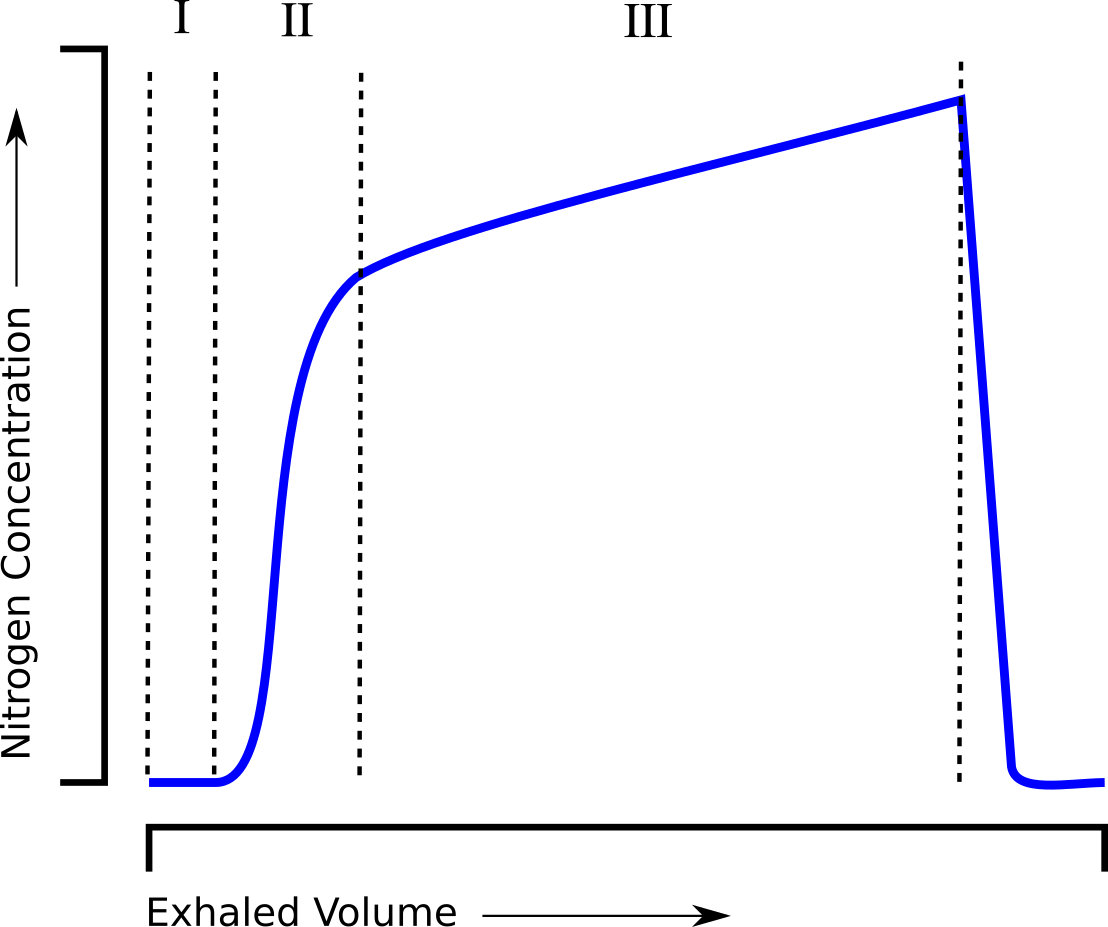
and can be similarly subdivided into phase I (dead space washout), phase II (transition) and phase III (alveolar gas).
The interesting thing is that the phase III slopes steadily increase as the LCI test progresses.
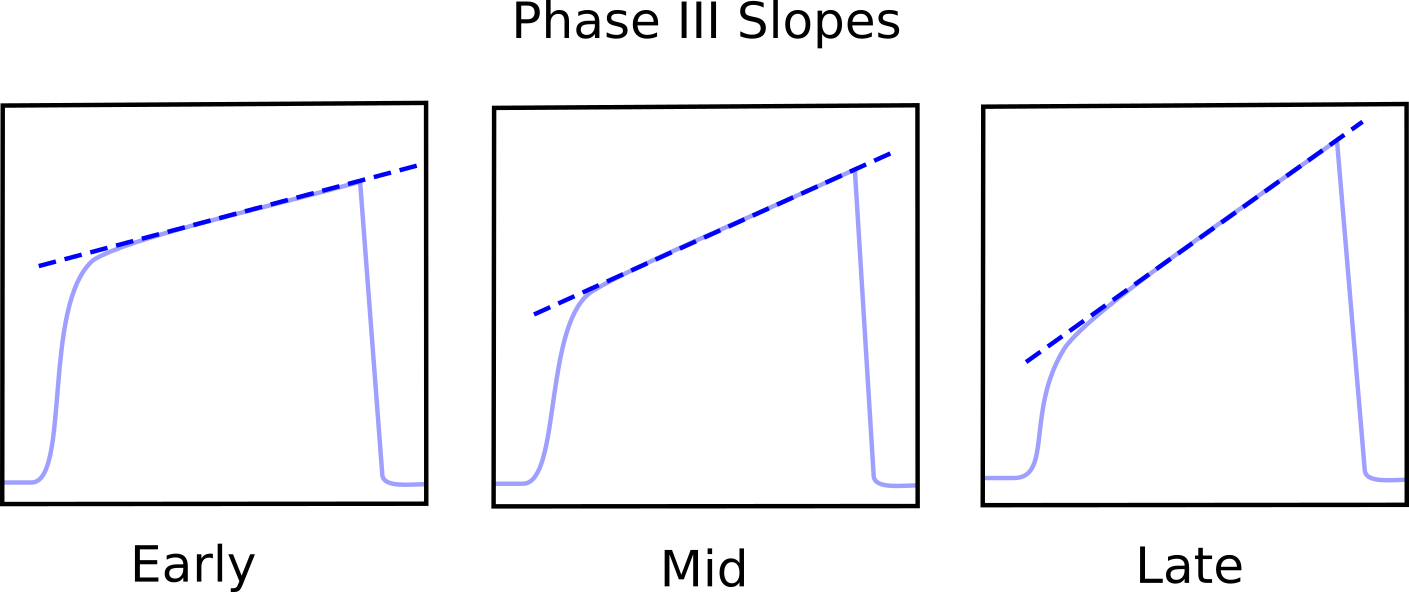
This occurs in subjects with normal lungs but the rate and the degree to which the slope increases is elevated in both COPD and Asthma. The phase III slopes are normalized by dividing by the average N2 concentration occurring under phase III and when this is plotted against lung turnover (which is the amount of ventilation equal to the subject’s FRC) the differences can between normal and obstructive lung disease can be seen.
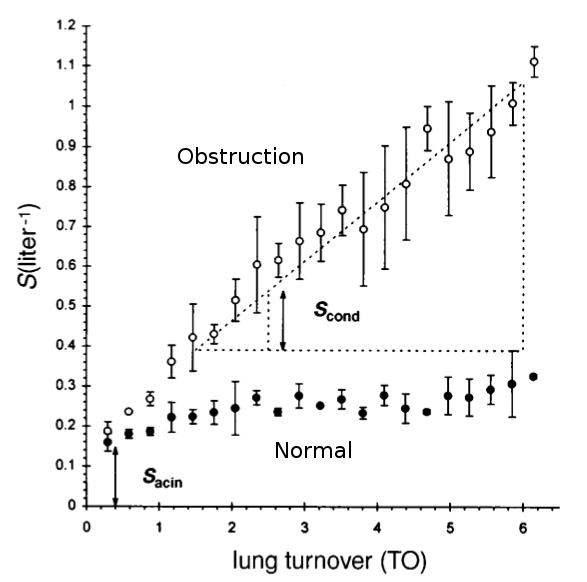
Modified from Verbanck S, Schuermans D, Van Muylem A, Paiva M, Noppen M, Vincken W. Ventilation distribution during histamine provocation. J Appl Physiol 1997; 83(6): Figure 3, page 1910.
By definition Scond is the slope of the phase III nitrogen washout slope versus ventilation (measured in turnovers to normalize for different sized lungs) derived by linear regression in the TO range 1.5 to 6. Sacin is the phase III slope of the very first expiration minus Scond times the TO of the first breath and is basically the offset of the Scond slope.
Normal values for Scond are around 0.033 and tend to increase with age. Normal values for Sacin are around 0.075 and the change with age tends to be minimal. Physiologically, Scond is thought to reflect ventilation heterogeneity occurring in the peripheral conducting airways, where gas transport is driven primarily by convection. Sacin is thought to reflect ventilation heterogeneity occurring within the acinar region of the lung, where gas transport is driven primarily by diffusion.
One study showed the LCI itself tended to correlate more with Scond than it did with Sacin but that LCI was also affected by ventilation inhomogeneities in the larger airways. A study of adult patients with cystic fibrosis showed somewhat different results in that that following exacerbation their LCI and Sacin improved significantly but that Scond did not change.
In particular Scond and Sacin have provided a lot of information about asthma and COPD. At the simplest level (and not surprisingly) there is a strong association with the degree of abnormality in Scond and Sacin and the degree of severity of both asthma and COPD.
For adult asthmatics researchers have noted the presence of significant ventilation inhomegeneity in their conducting airways (Scond) that is only partially reversible with inhaled bronchodilators. Interestingly, Sacin often showed larger changes and often normalized after the use of bronchodilator and this was seen in both smokers and subjects with normal lungs. During asthma exacerbations both Scond and Sacin worsened but Sacin tended to correlate with decreases in FEV1 while Scond did not.
The picture is more mixed during bronchoprovocation. Normal subjects who did not have a significant FEV1 decrease following histamine inhalation showed increases in both Scond and Sacin during bronchoprovocation that returned to baseline following a bronchodilator. Although subjects that did have a significant FEV1 decrease had an elevated Sacin at baseline but Sacin did not change significantly during bronchoprovocation or bronchodilation, while at the same time their Scond both increased and improved significantly.
Inhaled steroids have been shown to improve Sacin but Scond has tended to show little or no change, and researchers also saw that the greatest benefit of steroid therapy tended to be seen in subjects with the most abnormal Sacin values at baseline. Interestingly, despite the role that steroids play in controlling inflammation another study showed that the relationship between exhaled NO with Sacin which was not significant while Scond small but statistically significant correlation with exhaled NO.
An editorial by DA Kaminsky summarized the current clinical findings of Scond and Sacin with asthma:
| Clinical Feature: | Abnormal Scond: | Abnormal Sacin: |
| Stable asthma (adults) | + | – |
| Stable asthma (children) | + | – |
| Exhaled NO (inflammation) | – | + |
| Airway hyperreactivity | + | – |
| Methacholine response | + | + |
| Response to BD | + | ++ |
| Response to inhaled Steroids | + (large particles) | ++ (small particles) |
| Asthma severity (FEV1) | – | + |
| Asthma control | + | + |
| Acute exacerbation | ++ | + |
where:
| + | associated with feature |
| ++ | strongly associated with feature |
| – | not associated |
In a study of smokers with varying smoking histories, Scond and Sacin showed abnormalities in 10 ppy (pack per-year) smokers while spirometric abnormalities usually did not occur until after 20 ppy and DLCO abnormalities usually did not occur until after 30 ppy. Another study showed that smokers who quit showed an average improvement in Scond of 42% after 1 year, but any abnormalities in Sacin tended not to show any improvement at all.
Patients with COPD all tended to have an elevated Sacin, while Scond tends to increase according to the level of COPD severity. Interestingly, patients with COPD that showed a significant improvement in gas trapping with the use of tiotropium bromide (Spiriva) did not have significant changes in either Sacin or Scond so it appears that any improvements in lung mechanics did not change the underlying ventilation inhomogeneity.
There is still a lot that needs to be worked out before Scond and Sacin become routine clinical tests. One of the major factors that has kept Scond and Sacin measurements from routine clinical testing (and for that matter from more widespread research) is that measurement of the phase III slope is a time-consuming manual process. Because defining the phase III slope in a multi-breath N2 washout has the same problems as there are in the Fowler dead space measurement there is also no particular consensus on how it should be performed. A relatively recent paper showed that a computer algorithm could determine the phase III slopes as well as experienced researchers which opens the possibility that Scond and Sacin could be determined automatically. Unfortunately, in the 5 years since its publication this algorithm doesn’t appear to have been put into use by any other researchers.
There are also questions about how Scond and Sacin testing should be standardized. As one example, the Scond and Sacin version of an LCI test is performed with the subject being asked to maintain a 1 liter tidal volume. The reason for this has never been explained except that it was part of the protocol for one of the original studies on Scond and Sacin in the 1980’s. The effect of a 1 liter tidal volume versus the subject’s “normal” tidal breath was studied in children and it was shown that LCI was larger and FRC and Scond were smaller with 1 liter tidal breaths than they were with their normal tidal breaths. Interestingly Sacin increased at the 1 liter tidal volume in children with cystic fibrosis but decreased in those with normal lungs. The reason for these changes however, may be that for many of the children in the study a 1 liter tidal breath caused them to exhale below FRC (hence the reduced FRC measured during the LCI). At the present time there doesn’t appear to have been any research done on the effect that tidal volume has on LCI, Scond and Sacin in adults.
Finally, there are a number of technical issues that need to be addressed and these apply to all forms of the multi-breath nitrogen washout. In this kind of testing the signals from the flow sensor and the gas analyzer(s) occur in different time frames and need to be very precisely matched. A recent study showed that a +/- 40 millisecond mismatch in flow and analyzer signals led to significant decreases or increases in LCI and FRC depending on whether the change was + or -. Moreover, equipment deadspace, room temperature, barometric pressure and the location of the gas analyzer tap relative to the subject’s mouth also had measurable (and often significant) effects on LCI, FRC, Scond and Sacin.
The LCI test is relatively safe, simple and easy to perform and because it requires only tidal breathing this makes it suitable for children and patients who are otherwise unable or contraindicated from performing spirometry and other pulmonary function tests. Scond and Sacin can be derived from the phase III of exhaled N2 waveform that occurs during an LCI test and provide significantly more information about the potential sites of ventilation inhomogeneities within the lung than does the LCI alone. In particular Scond and Sacin also show significant promise for guiding and monitoring asthma therapies. Although the 2013 ERS/ATS guidelines for multi-breath washouts provide an overall framework for LCI, Scond and Sacin measurements, more research and more specific guidelines are needed before these measurements enter the clinical arena.
Note: One interesting point I ran across while researching this particular post was that there are no fast-responding nitrogen analyzers being manufactured anymore, regardless of whether it is for medical or even industrial use. All present-day PFT systems that perform N2 washout testing, which includes lung volumes, closing volume and the LCI, actually measure O2 (and sometimes CO2 as well). The thought behind this is basically that anything that isn’t O2 (or CO2 (and if they’re paying attention, argon)) in air, has to be nitrogen. That’s reasonably correct but at the same time all of these test systems use a flow sensor of one kind or another and the “indirect N2” signal has to be aligned and integrated with the flow signal using a high degree of precision in order to accurately measure the volume of nitrogen that’s being exhaled. The Lilly-type nitrogen analyzer (developed in the mid-1940’s by polymath John C. Lilly) that I worked with in the 1970’s and 1980’s was relatively large and mechanically complex (it required a vacuum pump) but the sample chamber was actually placed right next to the mouthpiece so the sample transport time was very low, and the analyzer itself had a response time on the order of 40 milliseconds. Most “high-speed” O2 and CO2 analyzers however, have response times that are usually >120 milliseconds (and also are usually different from each other which means that they have to aligned separately) and the gas sample is usually transported over catheters that are several feet long (with transport times in the hundreds of milliseconds). In order to make up for the relatively slow response of the gas analyzers and the “smearing” that occurs in transport most test systems use “predictive” algorithms of one kind or another. I’m not going to say that present-day N2 washout testing isn’t accurate, but I will say that when it comes to N2 gas analysis (and probably other things as well) we’ve accepted downgraded hardware and complex software as a substitute for far more capable (but admittedly more complex) hardware and I’m not sure that this has been an improvement.
References:
Crawford ABH, Makowska M, Paiva M, Engel LA. Convection- and diffusion-dependent ventilation maldistribution in normal subjects. J Appl Physiol 1985; 59(3): 838-846.
Downie SR, Salome CM, Verbanck S, Thompson B, Berend N, King GG, Ventilation heterogeneity is a major determinant of airway hyperresonsiveness in asthma, independent of airway inflammation. Thorax 2007; 62: 684-689.
Houltz B, Lindblad A, Singer F, Robinson P, Nielsen K, Gustaffson P. Tidal N2 washout ventilation inhomogeneity indices in a reference populatiopn aged 7-70 years. Eur Respir J 2012; 40: P3797.
Jetmalani K, Chapman DG, Thamrin C, Farah CS, Berend N, Salome CM, King GG. Bronchodilator responsiveness of peripheral airways in smokers with normal spirometry. Respirology 2016; 21: 1270-1276.
Kaminsky DA. Multiple breath nitrogen washout profiles in asthmatic patients: What do they mean clinically? J Allergy Clin Immunol 2013;131:1329-30.
Macleod KA, Horsley AR, Bell NJ, Greening AP, Innes JA, Cunningham C. Ventilation heterogeneity in children with well controlled asthma with normal spirometry indicates residual airways disease. Thorax 2009; 64: 33-37.
Robinson PD, Latzin P, Verbanck S, et al. ERS/ATS Consensus statement. Consensus statement for intert gas washout measurement using multiple- and single-breath tests. Eur Respir J 2013; 41: 507-522.
Stuart-Andrews CR, Kelly VJ, Sands SA, Lewis AJ, Ellis MJ, Thompson BR. Automated detection of the phase III slope during inert gas washout testing. J Appl Physiol 2012; 112: 1073-1081.
Summermatter S, Singer F, Latzin P, Yammine S. Impact of software settings on multiple-breath washout outcomes. PLOS One 2015; 10(7): e0132250.
Thompson BR, Douglass JA, Ellis MJ, Kelly VJ, O’Hehir RE, King GG, Verbanck S. Peripheral lung function in patients with stable and unstable asthma. J Allergy Clin Immunol 2013; 131: 1322-1328.
Vanderhelst E, De Meirleir L, Schuremans D, Malfroot A, Vincken W, Verbanck S. Evidence of an acinar response following treatment for exacerbations in adult patients with cystic fibrosis. Respiration 2014; 87: 492-498.
Verbanck S, Schuermans D, Van Muylem A, Paiva M, Noppen M, Vincken W. Ventilation distribution during histamine provocation. J Appl Physiol 1997; 83(6): 1907-1916.
Verbanck S, Schuermans D, Van Muylem A, Melot C, Noppen M, Vincken W, Paiva M. Conductive and acinar lung-zone contributions to ventilation inhomogeneity in COPD. Am J Respir Crit Care Med 1998; 157: 1573-1577.
Verbanck S, Schuermans D, Paiva M, Vincken W. Nonreversible conductive airway ventilation heterogeneity in mild asthma. J Appl Physiol 2003; 94: 1380-1386.
Verbanck S, Schuermans D, Meysman M, Paiva M, Vincken W. Noninvasive assessment of airway alteration in smokers. The small airways revisited. Am J Respir Crit Care Med 2004; 170: 414-419.
Verbanck S, Schuermans D, Paiva M, Vincken W. The functional benefit of anti-inflammatory aerosols in the lung periphery. J Allergy Clin Immunol 2006; 118: 340-346.
Verbanck S, Schuremans, Paiva M, Meysman M, Vincken W. Small airways function improvement after smoking cessation in smokers without airway obstruction. Am J Respir Crit Care Med 2006; 174: 853-857.
Verbanck S, Schuermans D, Vincken W. Small airway heterogeneity and hyperinflation in COPD: response to tiotropium bromide. Int J COPD 2007; 2(4): 625-634.
Verbanck S, Schuermans D, Vincken W. Inflammation and airway function in the lung periphery of patients with stable asthma. J Allergy Clin Immunol 2010; 125: 611-616.
Verbanck S, Paiva M, Schuermans D, Hanon S, Vincken W, Van Muylem A. Relationships between the lung clearance index and conductive and acinar ventilation heterogeneity. J Appl Physiol 2012; 112: 782-790.
Yammine S, Singer F, Gustafsson P, Latzin P. Impack of different breathing protocols on multiple-breath washout outcomes in children. J Cystic Fibrosis 2014; 13: 190-197.
Dear Richard,
thanks a lot for your fantastic explanations that help me to understand LCI, Scond and Sacin better. Especially your explanation that the slopes increase as as the LCI porgesses was very helpful. We are collecting data for LCI, Scond and Sacin in patients with interstital lung disease but still I have got some questions:
1. LCI and lung turnover – is there are difference or is it the same?
2. Figure 3 from Sylvia – I still do not understand: Scond starts with 0.2 L and increases with lung turnovers up to 0.9 L ; Sacin stats with 0.2 L and stays stable with increasing TO.? I think the main problem for me to understand this is that I still do not understand TO.
3. Your explanation of Sacin says “… minus Scond Times…”. What does “Scond Times” mean.
Sorry for asking, but could you please explain this for me?
Best regards,
Sven
Dr. Stieglitz –
1) Lung turnover is the amount of ventilation (Vt * RR) that equals FRC. LCI is the number of turnovers. Theoretically, normalizing the LCI to the FRC accounts for different lung sizes.
2) The graph actually says SLiters, not Liters, which is the normalized alveolar slope and I’d refer you to her 1997 JAP article to understand that.
3) Times means multiplied by.
Regrettably, I think that the accuracy of historical LCI, Sacin and Scond measurements has become somewhat questionable. In particular the LCI measured using N2 has recently been shown to be significantly higher than the LCI measured with SF6 and that this appears to be largely due to the washout of N2 from the subject’s blood and tissue. Most researchers performing N2 washout LCI testing have considered that the contribution of blood and tissue N2 to the calculated LCI to be negligible and this appears not to be true. Having said that, I have some issues with the way in which the SF6 was administered in the comparative LCI measurements and suspect that LCI may be underestimated when SF6 was used. I still think the basic principle behind the LCI is correct but the problem is that it’s become evident that LCI depends on which gas (and which underlying algorithms) are being used to measure it.
Regards, Richard