I’d spent some time researching single-breath tests a while back and of course ran across the Fowler method for measuring anatomic dead space. It’s a relatively simple test but assessing its results as well as the results of alternate dead space measurement techniques turns out to be more complicated than I had remembered.
The official definition of anatomic dead space is that it is that part of the inhaled volume that remains in the airways at the end of inhalation and does not participate in gas exchange. An accurate estimate of this volume is important because respiratory dead space (Vd/Vt, discussed previously) is composed of both anatomical and physiological dead space. The physiological component of the respiratory dead space cannot be determined without knowing the anatomical dead space.
Anatomic dead space is usually considered to be the physical volume of the airways but static measurements of airway volume do not take into consideration the dynamic aspects of respiration. The most commonly used method for measuring anatomic dead space in a research setting is the single-breath technique developed by Fowler in 1948. In this method, after an inhalation of oxygen, the nitrogen concentration in an individual’s exhalation is plotted against exhaled volume.
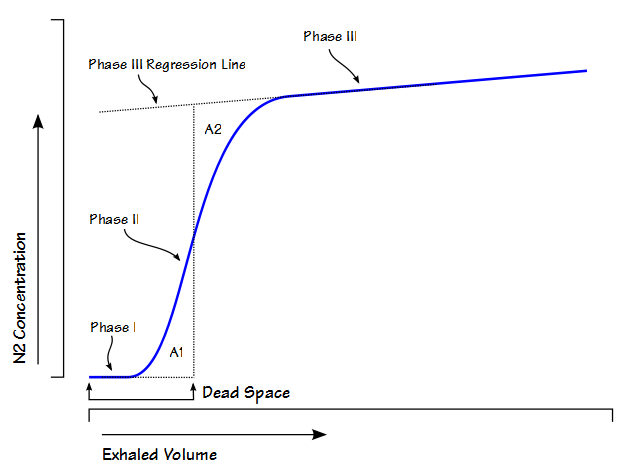
During exhalation, phase I is where nitrogen-free gas is exhaled from the airways. Phase II is the S-shaped transition between pure deadpace gas and alveolar gas. Phase III is alveolar gas. Fowler back-extrapolated the phase III slope and using a planimeter (a mechanical device that measures area) he found the mid-point of Phase II that was defined by equal areas (A1, A2). Numerous gases have been studied for this purpose (helium, oxygen, nitrogen, argon, nitrous oxide, carbon dioxide) and they all produce similar curves and with the possible exception of helium they all produce reasonably similar values for dead space. Theoretically, the Fowler dead space measurement could be performed by any system capable of measuring single-breath nitrogen washouts but it is actually performed most frequently by volumetric capnography systems used to monitor ICU patients and patients undergoing anesthesia. For this and other reasons anatomic dead space is now most frequently measured using CO2.
The most frequent criticism of the Fowler technique has been the way the phase III regression line is back-extrapolated and that is because it is “selected by drawing a straight line along the alveolar plateau and extending it to the left.” The alveolar plateau is not necessarily even or flat so the accuracy of the regression line is up to the observer’s eye.
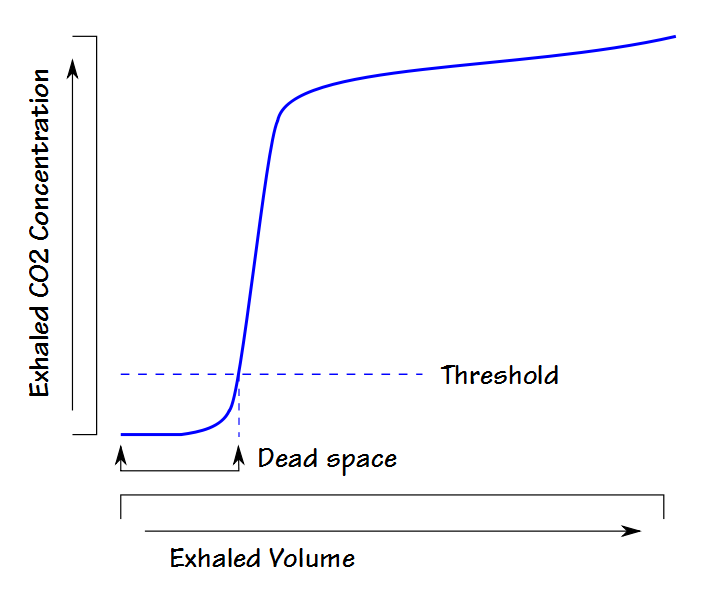
For this reason other approaches to measuring dead space have been developed. Because volumetric capnographs are usually automated a lot of attention has been towards approaches suitable for computer algorithms. A particularly simple example of this is the threshold technique. A specific exhaled CO2 threshold (usually just above the noise or zero level) is selected and the exhaled volume up to the point the threshold is exceeded is considered to be dead space. This approach likely underestimates dead space because the measurement primarily consists of the volume in phase I. It is however, very easy to implement and has been occasionally used on ventilators and anesthesia equipment.
Another approach is to look at the rate of change in CO2 during exhalation. When this is plotted, the peak value is equivalent to the highest slope of the phase II part of exhalation which usually occurs in the middle of the phase II slope, which is also presumed to be equivalent to the dead space volume.
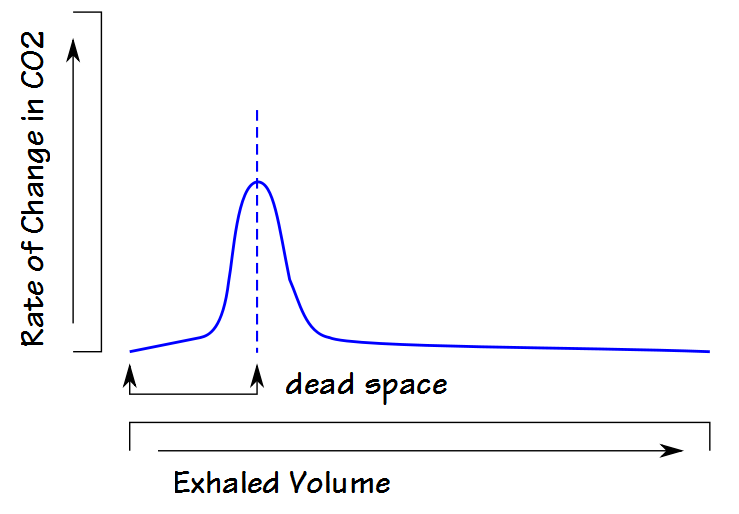
This technique is sensitive to both analyzer noise and the data sampling interval and for this reason the results are often poorly reproducible.
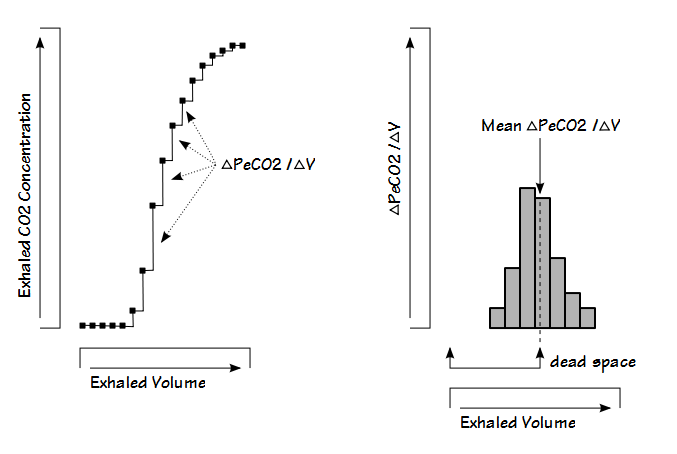
The Pre-Interface Expirate (PIE) algorithm uses multiple steps. The first is to divide the maximum exhaled CO2 (usually the PETCO2) by two and use this to select a location within phase II of the exhalation. The volume at this location is then used to isolate a larger section of the phase II (and possibly part of phase III).
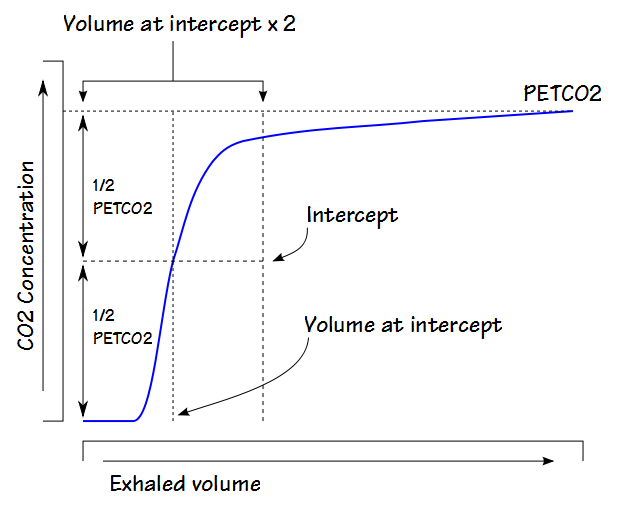
The ΔPeCO2/ΔVolume is then calculated at intervals (usually the sampling frequency or some fraction thereof) for this section of the exhalation and finally, the average of the interval’s ΔPeCO2/ΔVolumes is obtained. The exhaled volume corresponding to the average value is then considered to be the dead space.
The dead space calculated by the PIE technique is sensitive to the maximum exhaled PECO2 (because that determines how much, if any, of phase III is included in the calculations) and alternate versions of this approach have been proposed that “adjust” the maximum exhaled PECO2 in one way or another.
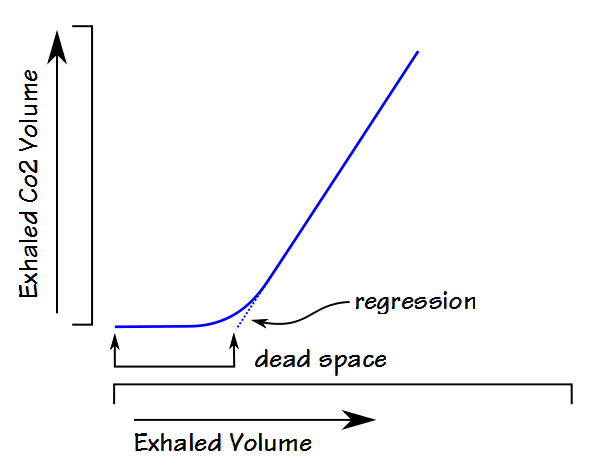
Fowler’s method plotted the exhaled CO2 concentration against the exhaled volume but a number of the alternate methods plots the exhaled CO2 volume against the exhaled volume and uses linear line-fitting or linear regression analysis with either second-order or third-order polynomials to back-extrapolate.
To some extent the approaches using exhaled CO2 volume rather than CO2 concentration show less variance and higher repeatability than the Fowler technique. Researchers have shown that the Fowler technique is sensitive to CO2 analyzer noise and this noise is reduced during the integration process for exhaled CO2 volume. The alternate techniques appear to have their own sensitivities to such things as the phase III slope however, which is usually significantly increased in patients with COPD and asthma. Although some of the alternate techniques produce relatively reproducible results there is no clear consensus as to which of these approaches is most accurate or whether they are accurate at all.
When interpreting the results of dead space measurements it must be remembered that airway volume and therefore anatomical dead space is not a fixed quantity. Airway volume depends on posture and is largest when an individual is in the upright position and lowest in the supine or prone positions, with the recumbent position being in-between. Airway volume also depends on lung volume and is largest at TLC and smallest at RV. It is usually assumed that when it is reported that unless otherwise specified airway dead space is measured from an inhalation that started at FRC.
Anatomical dead space measurements are also sensitive to breath holding time and for this reason Cotes recommends a breath holding time of 0.4 to 0.6 seconds. Prolonged breath holding time, whether deliberate or accidental, tend to decrease the measured volume. This is presumed to be due to cardiogenic mixing in the airways and not to diffusion. In addition at least one study showed that measured dead space increases as respiratory rate increases although the reason this occurs is not clear. Finally, results from another study indicated that measured dead space may also increase as tidal volume increases.
Vd/Vt is frequently measured in a variety of situations using the modified Bohr equation with arterial PCO2 and mixed-expired CO2. The Bohr (respiratory) dead space is a combination of anatomical and physiological dead space. Anatomical dead space however, is most often estimated rather than measured and when it is estimated the simple formula of 1 ml per pound of body weight is most often used. This relationship originated from a study performed in 1955 and clinicians have used both actual and estimated body weight (although they have often failed to specify which) for this purpose. A recent study has indicated that neither actual or predicted body weight is a reliable indicator of dead space. This is not surprising since other studies have shown that dead space volume in fact correlates best with FRC or TLC.
There are a small handful of reference equations for airway dead space and the majority of them are based on values other than weight
From [1]:
Vd (ml) = 4.9 + (0.0113 x TLC) + (0.062 x tidal volume (ml))
Where:
Male TLC = ((7.61 x ht (M)) – (0.019 x wt (kg)) – 4.73) x 1000
Female TLC = ((7.38 x ht (M)) – (0.016 x age) – 6.35) x 1000
From [2]:
Male:
Vd (ml) = 3.846 x ht(cm)2.499 x 10⁻⁴
Vd (ml) = (1.765 x wt (kg)) + 32.16
Vd (ml) = Antilog((0.393 x BSA(M2)) + 1.468)
Vd (ml) = (36.703 x FRC (L, measured)) + 49.381
Female:
Vd (ml) = 23.823 x ht(cm)2.131 x 10⁻⁴
Vd (ml) = (1.913 x wt (kg)) + 21.267
Vd (ml) = Antilog ((1.913 x wt(kg)) + 1.407)
Vd (ml) = (38.175 x FRC (L, measured)) + 36.593
From [3], male and female:
Vd (ml) = (194 x ht (M)) – 73
Volumetric capnograph monitors are frequently used to monitor ventilated patients during anesthesia or in the intensive care unit and many of these devices are capable of automatically calculating airway dead space. This may be a useful measurement but users of these devices should be aware of which method is being used to measure dead space volume and the factors that can affect their results.
Anatomical dead space is often perceived as the volume of the conducting airways. To some extent this is true but during an inhalation some alveoli receive fresh gas well before the presumed anatomical dead space has cleared the airways and some alveoli receive fresh gas only well after it has cleared. All techniques that measure anatomical dead space use an averaging process of one kind or another and depending on the technique the measured dead space can be biased by the phase I, phase II or phase III parts of exhalation. There is no particular consensus on dead space measurement techniques and for this reason, the original Fowler technique, despite its known limitations, continues to be the most commonly performed technique, even when only used as a comparison.
Researchers and clinicians often use an individual’s body weight as a way to estimate anatomical dead space in order to determine physiological dead space but this is an oversimplification and likely to be inaccurate. In addition dead space is not a fixed value and depends on posture and lung volume but these facts are often overlooked. Despite all these issues anatomical dead space remains an important concept and is an important factor in the ventilation of the lung.
References:
[1] Astrom E, Niklason L, Drefeldt B, Bajc M, Jonson B. Partitioning of dead space – a method and reference values in the awake human. Eur Respir J 2000; 16: 659-664.
Bartels J, Severinghaus JW, Forster RE, Briscoe WA, Bates DV. The respiratory dead space measured by single breath analysis of oxygen, carbon dioxide, nitrogen or helium. J Clin Invest 1954; 33(1): 41-48.
Brewer LM, Orr JA, Pace NL. Anatomic dead space cannot be predicted by body weight. Resp Care 2008; 53(7): 885-891.
Cotes JE, Chinn DJ, Miller MR. Lung Function, 6th Edition. Blackwell Publishing, 2006.
Fowler WS. Lung function studies. II. The respiratory dead space. Amer J Physiol 1948; 154: 405-416.
Fowler WS. Lung function studies. IV. Postural changes in respiratory dead space and functional residual capacity. J Clin Invest 1950; 29(11): 1437-1438.
[2] Hart MC, Orzalesi MM, Cook CD. Relation between anatomic respiratory dead space and body size and lung volume. J Appl Physiol 1963; 18(3): 519-522.
Hatch T, Cook KM, Palm PE. Respiratory dead space. J Appl Physiol 1953; 5(7): 341-347.
Heller H, Konen-Bergman M, Schuster K-D. An algebraic solution to dead space determination according to Fowler’s graphical method. Comp Biomed Research 1999; 32: 161-167.
[3] Kars AH, Bogaard JM, Stijnen T, de Vries J, Verbraak AFM, Hilvering C. Dead space and slope indices from the expiratory carbon dioxide tension-volume curve. Eur Respir J 1997; 10: 1829-1836.
Radford EP. Ventilation standards for use in artificial respiration. J Appl Physiol 1955; 7(4): 451-460.
Tang Y, Turner MJ, Baker AB. Systematic errors and susceptibility form noist of four methods for calculating anatomical dead space from the CO2 expirogram. Brit J Anaesth 2007; 98: 828-834.
Wolff G, Brunner JX, Weiberl W, Bowes CL, Muchenberger R, Bertschmann. Anatomical and series dead space volume: concept and measurement in clinical praxis. Applied Cardiopulmonary Pathophysiology 1989; 2: 299-307.

PFT Blog by Richard Johnston is licensed under a Creative Commons Attribution-NonCommercial 4.0 International License