What’s normal about airway resistance?

The question that was actually posed to me a month or so ago was “when is RAW abnormal?” I didn’t have a good answer at the time since airway resistance (RAW) tests are not performed by my lab. The pulmonary physicians I work with don’t think that RAW is a clinically useful measurement and for a variety of reasons I don’t disagree with this. Nevertheless, RAW testing is routinely performed in many labs around the world so I thought it would be interesting to spend some time researching this.

When asking what’s normal the first issue is which RAW value are you talking about? The measurement of airways resistance using a body plethysmograph was first described by DuBois et al in 1956. Airway resistance (RAW) is the amount of pressure required to generate a given flow rate and is reported in cm H2O/L/Sec. A number of physiologists quickly found that the reciprocal of RAW, conductance (GAW), which is expressed as the flow rate for a given driving pressure (L/sec/cm H2O), was also a useful way to describe the pressure-flow relationship of the airways.

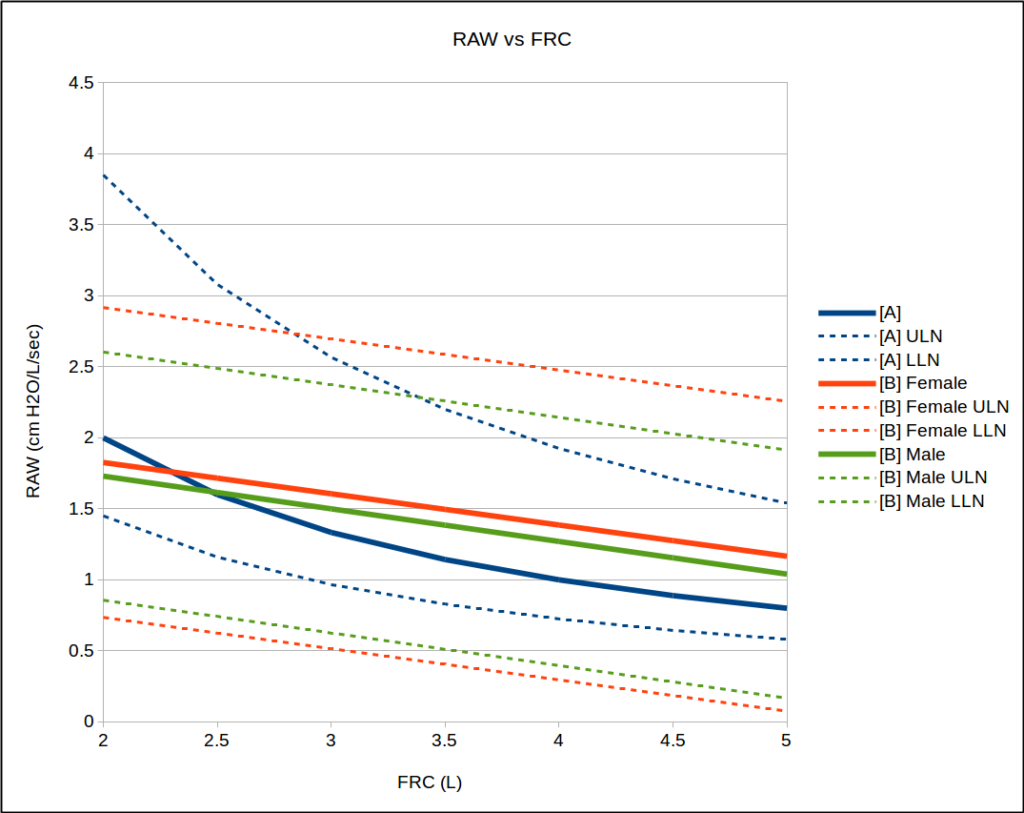
For technical reasons TGV (Thoracic Gas Volume) must be measured at the same time as RAW. It was soon noted that there was a relationship between RAW and TGV and that airway resistance decreased as lung volume increased.

Continue reading

Making Assumptions about TGV and FRC

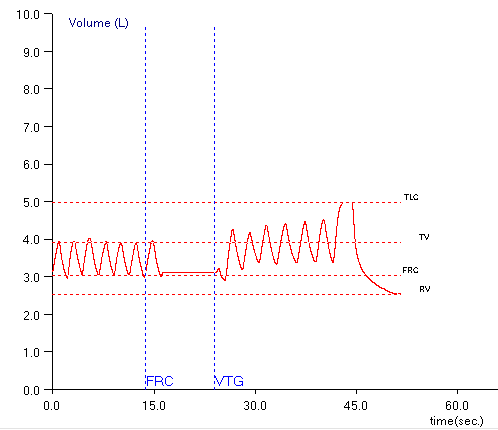
When lung volumes are measured in a plethysmograph the actual measurement is called the Thoracic Gas Volume (TGV). This is the volume of air in the lung at the time the shutter closes and the subject performs a panting maneuver. Ideally, the TGV measurement should be made at end-exhalation and should be approximately equal to the Functional Residual Capacity (FRC). For any number of reasons in both manual and automated systems this doesn’t happen and the point at which the TGV is measured is either above or below the FRC.

Testing software usually corrects for the difference in TGV and FRC by determining the end-exhalation baseline that is present during the tidal breathing at the beginning of the test. Using this value the software can determine where the TGV was measured relative to the tidal breathing FRC and then either subtracts or adds a correction factor to derive the actual FRC volume.

One problem with this is that leaks in either the subject or the mouthpiece and valve manifold can occur during the panting maneuver and the end-exhalation baseline can shift and this will affect the calculation of RV and TLC. I’ve discussed this previously and as a reminder, RV is calculated from:

RV = [average FRC] – [average ERV]

where the FRC is determined from the corrected TGV and ERV is determined from SVC maneuvers. TLC is then calculated from:

TLC = RV + [largest SVC]

When the post-shutter FRC baseline shifts upwards (higher lung volumes relative to the pre-shutter FRC):

ERV is underestimated, which in turn causes both RV and TLC to be overestimated. When the post-shutter FRC baseline shifts downwards (lower lung volumes relative to the pre-shutter FRC):

ERV is overestimated, which in turn causes both RV and TLC to be underestimated.

I’ve been aware of this problem for quite a while and use this as a guideline when selecting the FRCs and SVCs from specific plethysmograph tests. All of these assumptions are based on the fact that FRC is derived from the pre-shutter end-exhalation tidal breathing. Well, you know what they say about assuming…

Continue reading

Measuring respiratory resistance with the APD

Inspiratory and expiratory flow rates are a function of driving pressure (i.e. the pressure difference between the alveoli and the atmosphere) and airway resistance. For this reason it would seem that airway resistance should be one of the most commonly performed pulmonary function tests but instead it is the outcome of airway resistance and driving pressure, i.e. the expiratory and inspiratory flow rates that are measured almost exclusively. One reason for this is that resistance measurements requires relatively expensive equipment such as a body plethysmograph or an impulse oscillometer as well as a fair amount of technical expertise.

The airflow perturbation device (APD) is a potentially inexpensive system for measuring respiratory resistance during tidal breathing. The device itself is mechanically simple, the concepts and mathematics that permit it to work are, however, a bit more complicated.

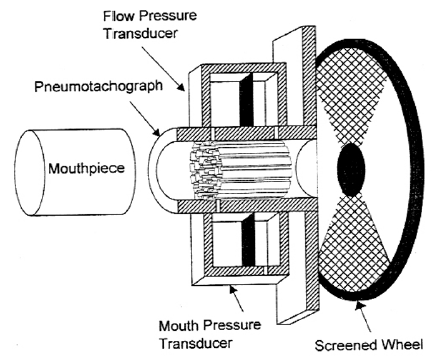
The APD consists of a mouth pressure transducer and a pneumotach whose end is attached to a rotating wheel. The wheel has open segments and segments with a mesh that partially obstructs airflow through the pneumotach. The rotation of the wheel causes a series of perturbations to the airflow through the pneumotach.

Continue reading

What’s the frequency, plethysmograph?

Once again we’ve had some staff turnover. Rightly or wrongly, the pattern we follow in staffing the lab is to hire people with a science degree and then train them ourselves. Our hires are usually interested in a career in medicine but often haven’t decided what specifically interests them. We look for individuals with people skills on top of their education and ask for a minimum of a year’s commitment with the requirement that they get their CPFT certification by the end of the year. Sometimes our staff only stays a year, sometimes a couple years, and most of the time when they leave they go back to college for a more advanced degree and become nurses or physician assistants and occasionally even physicians (a couple of our pulmonary fellows were former PFT lab alumni).

We do this mostly because it’s very hard to find anybody with prior experience in pulmonary function testing. I’d like to say this is a recent occurrence but realistically it’s been this way for decades. One of the reasons for this is that there are no college level courses on pulmonary function testing. Although the training programs for respiratory therapists often include some course work on PFTs this is almost always a one semester lecture course with no hands-on training (when it is included at all).

Another reason is that trained individuals often do not stay in this field. This is partly because there isn’t much of a career path since the most you can usually aspire to is being a lab manager but even then I know of many small PFT labs where the manager is somebody outside the field such as a nurse or administrator with no experience in pulmonary function testing so often that isn’t even an option. Another reason though, is that the PFT Lab pay scale, although adequate, is often noticeably less than other allied health professions such as radiology techs, ultrasound techs and sleep lab techs.

Anyway, the downside of this hiring pattern is that it seems like we’re always hiring and training new staff (however untrue that may actually be). We do have a fairly good training program however, so new staff usually come up to speed and become reasonably productive in a short period of time. Even so, it takes at least a year before a new technician is reasonably proficient not just in performing the tests, but in understanding the common testing problems and errors. This is at least one reason why I spend much of my time reviewing raw test data and sending annoying emails to the lab staff.

It also means that we frequently revisit basic testing issues.

Recently, a report with a full panel of tests (spirometry, lung volumes, DLCO) came across my desk. The patient had had a full panel a half a year ago and when I compared the results between the two sets of tests there had been no significant change in FVC, FEV1 and DLCO but the TLC was over a liter higher than it had been last time.

Jan, 2017 June, 2016
Observed: %Predicted: Observed: %Predicted:
FVC: 2.04 85% 2.38 97%
FEV1: 0.58 32% 0.62 34%
FEV1/FVC: 28 38% 26 36%
TLC: 7.27 152% 6.10 126%
FRC: 6.16 222% 4.83 174%
DLCO: 8.12 51% 8.91 55%

Continue reading

Opto-Electronic Plethysmography (OEP)

Although we routinely use mouthpieces, noseclips and occasionally masks for our testing, all of these alter respiration in one way or another. Opto-electronic plethysmography (OEP) is a completely non-invasive technique for measuring chest wall volume that also allows for regional differences in expansion and contraction of the thorax to be detected.

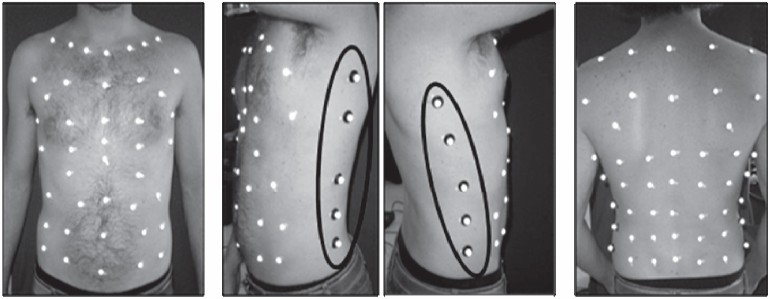
The basic idea is simple and is the same as is used in cinematic motion-capture systems. Small (6-10 mm) reflective hemispheres are attached to a subject’s torso with double sided tape. A set of 4, 6 or 8 high-speed (60-120 frames/sec) CCD cameras are then used to monitor both the overall and the relative motion of the hemispheres while the subject breathes. The accuracy of these measurements is claimed to be on the order of 0.2 mm.

OEP_Reflector_Placement

from Optoelectronic plethysmography: a review of the literature. Braz J Phys Ther 2012; 16: page 441.

The volume enclosed by the markers is analyzed geometrically by using a triangular or polyhedronal mesh. Since the triangles or polyhedrons are flat and human thoraxes are round-ish, volume tends to be underestimated to some degree. The amount of underestimation is closely related to the number of markers that are used and where they are placed. Research has shown that around 50 markers are needed for supine patients when only the anterior thorax is measured and more than 80 are needed for full coverage of upright patients. Reflectors need to cover the entire thorax, usually from the jugular notch on the upper chest to the iliac crest near the hips.

OEP_Triangular_Mesh

From Chest wall motion and lung volume estimation by optical reflectance motion analysis. J Appl Physiol 1996; 81: page 2683.

Continue reading

It isn’t a Raw without a TGV

One of the key reasons to perform spirometry is to measure expiratory flow rates. The flow rate of air through any system is primarily a function of driving pressure and resistance. Since there are limits to anybody’s ability to increase driving pressure (and physiological reasons why airflow does not continue to increase when driving pressure exceeds a certain threshold value) FEV1 is largely related to the amount of resistance in the airways.

The gold standard for measuring airway resistance (Raw) has been plethysmography. Like many other pulmonary function tests measuring Raw depends on a series of assumptions and a standardized approach to assessing the results. One of the standardizations is that a Raw maneuver must always be paired with a TGV maneuver. Although the knowledge of lung volume allows values like specific resistance (sRaw) and specific conductance (sGaw) to be calculated, this is not the reason for the TGV maneuver at all.

Resistance is calculated from:

 Resistance Formula

Inspiratory and expiratory flow rates are relatively easy to measure but the driving pressure, which in this case is alveolar pressure, is not. For this reason an indirect approach is needed to estimate alveolar pressure.

Continue reading

What’s abnormal about FRC?

I’ve had a number of reports across my desk in the last couple of weeks with both elevated and reduced FRC’s that were associated with a more-or-less normal TLC. I reviewed the raw data from all of these tests (I review the raw data from all lung volume tests) and in only a few instances did I make any corrections to the report. This made me think however, about what, if anything, is an abnormal FRC trying to tell us?

The answers to that question range from “a whole bunch” to “not much” to “darned if I know”. When you measure lung volumes TLC is really the only clinically important result. RV can be useful at times but although the other lung volume subdivisions may play a role in the measurement process they have only a limited diagnostic value. All lung volume measurements start with FRC, however, and if you don’t know you have an accurate FRC how do you know that TLC is accurate?

FRC is a balance point of opposing forces in the lung and thorax. Lung tissue wants to collapse, the rib cage wants to spring open and the diaphragm wants to do whatever muscle tone, gravity and the abdomen allows it to do. All of these forces are to one extent or another dynamic and can change over time. These changes can occur both slowly and rapidly, and are the primary reason why isolated changes in FRC don’t tend to have a lot of clinical significance. For all lung volume measurements however, one primary assumption is that FRC does not change during the test and this isn’t necessarily true.

Continue reading

Measuring Thoracic Gas Compression

During exhalation air flow occurs because of the pressure difference between the alveoli and the surrounding atmosphere. The increase in alveolar pressure acts to compress the air inside the lung and because of this compression the decrease in lung volume during exhalation is always going to be greater than the volume of exhaled air. This effect is known as Thoracic Gas Compression (TGC).

The flow rate that occurs for a given alveolar pressure depends primarily on airway resistance. When an individual has airway obstruction their airway resistance is increased and they often attempt to increase their expiratory flow by increasing the amount of force they apply during exhalation. This increased force further compresses the air inside the lung and increases TGC. Numerous researchers have shown that there is usually a substantial differences in TGC between subjects with normal lungs and those with airway obstruction.

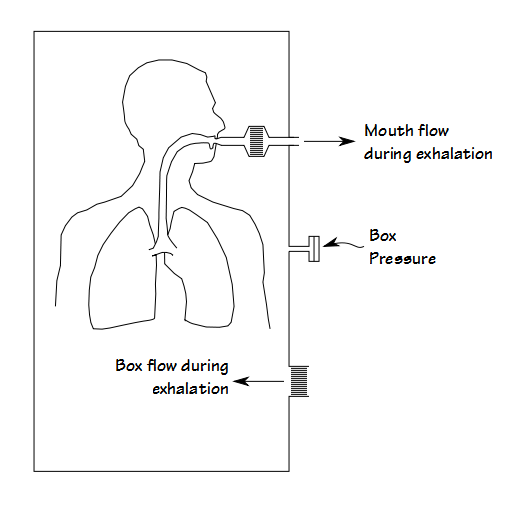
Routine spirometry and lung volume tests cannot measure thoracic gas compression. It can only be measured in a special kind of plethysmograph. Unfortunately the nomenclature for this type of plethysmograph is a bit muddy and it is variously known as a transmural, constant pressure, volume-displacement or flow plethysmograph (I prefer volume-displacement because I think this sums up its mode of operation most succinctly). In this type of plethysmograph the subject breathes in and out through an opening in the box. The expansion and contraction of their lungs causes air to flow in and out of the box through a separate opening. The pressure inside the plethysmograph is monitored and used to compensate for any delays in box flow.

Volume-displacement plethysmography

Volume-displacement plethysmography

Continue reading

FRC baseline shift affects TLC and RV

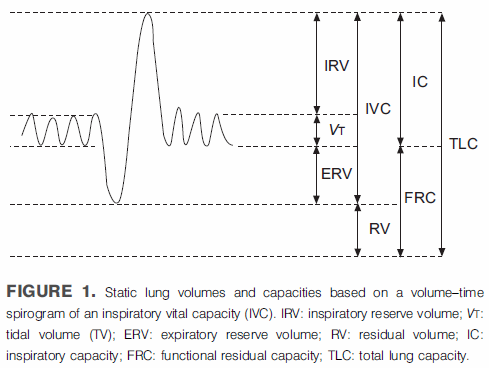
The plethysmographic technique for measuring lung volumes determines FRC first and then uses a slow vital capacity maneuver to calculate TLC and RV. FRC is defined as the volume of the lung at the end of a normal exhalation. The two components of the SVC maneuver that are used to calculate TLC and RV are the Inspiratory Capacity (IC) and the Expiratory Reserve Volume (ERV) and they too are measured relative to FRC. It would therefore seem to be important to have an accurate notion as to where FRC is in relation to TLC and RV when measuring lung volumes.

From ATS-ERS Standardisation of lung volume measurements, page 512

From ATS-ERS Standardisation of lung volume measurements, page 512

Plethysmography measures lung volumes by having a patient pant against a closed shutter and measuring pressure changes. The test is usually performed by having the patient breathe tidally for a period in order to determine where end-exhalation (FRC) is located, closing the shutter and performing the measurement, then returning to tidal breathing and performing the SVC maneuver. A critical assumption in this process is that the FRC baseline does not change while the shutter is closed.

Continue reading

The ERV Effect

I used to think that spirometry and diffusion capacity tests were hard and that lung volumes were easy. That may have been true in terms of getting patients to do the tests but I’ve long since come to the conclusion that it is easier to assess the quality of spirometry and diffusing capacity tests and know whether you have reasonably accurate results than it is to do this for lung volumes regardless of which lung volume measurement technique you use.

I was reviewing a set of plethysmographic lung volume tests when I noticed something very odd about the reported results. I usually look at just the VTG loops and the volume-time graphs in order to assess test quality. The testing software automatically selects and averages all VTG efforts and when I reviewed them there were a couple loops that were poor quality and I manually de-selected them. I was reviewing this report because the reported lung volume results didn’t quite match what the spirometry results were saying so this time I also took a close look at the numbers after I removed the low-quality loops. That’s when I realized that the reported TLC was larger than the two tests it was averaged from.

Pleth Math

Continue reading