Once again we’ve had some staff turnover. Rightly or wrongly, the pattern we follow in staffing the lab is to hire people with a science degree and then train them ourselves. Our hires are usually interested in a career in medicine but often haven’t decided what specifically interests them. We look for individuals with people skills on top of their education and ask for a minimum of a year’s commitment with the requirement that they get their CPFT certification by the end of the year. Sometimes our staff only stays a year, sometimes a couple years, and most of the time when they leave they go back to college for a more advanced degree and become nurses or physician assistants and occasionally even physicians (a couple of our pulmonary fellows were former PFT lab alumni).
We do this mostly because it’s very hard to find anybody with prior experience in pulmonary function testing. I’d like to say this is a recent occurrence but realistically it’s been this way for decades. One of the reasons for this is that there are no college level courses on pulmonary function testing. Although the training programs for respiratory therapists often include some course work on PFTs this is almost always a one semester lecture course with no hands-on training (when it is included at all).
Another reason is that trained individuals often do not stay in this field. This is partly because there isn’t much of a career path since the most you can usually aspire to is being a lab manager but even then I know of many small PFT labs where the manager is somebody outside the field such as a nurse or administrator with no experience in pulmonary function testing so often that isn’t even an option. Another reason though, is that the PFT Lab pay scale, although adequate, is often noticeably less than other allied health professions such as radiology techs, ultrasound techs and sleep lab techs.
Anyway, the downside of this hiring pattern is that it seems like we’re always hiring and training new staff (however untrue that may actually be). We do have a fairly good training program however, so new staff usually come up to speed and become reasonably productive in a short period of time. Even so, it takes at least a year before a new technician is reasonably proficient not just in performing the tests, but in understanding the common testing problems and errors. This is at least one reason why I spend much of my time reviewing raw test data and sending annoying emails to the lab staff.
It also means that we frequently revisit basic testing issues.
Recently, a report with a full panel of tests (spirometry, lung volumes, DLCO) came across my desk. The patient had had a full panel a half a year ago and when I compared the results between the two sets of tests there had been no significant change in FVC, FEV1 and DLCO but the TLC was over a liter higher than it had been last time.
| Jan, 2017 | June, 2016 | |||
| Observed: | %Predicted: | Observed: | %Predicted: | |
| FVC: | 2.04 | 85% | 2.38 | 97% |
| FEV1: | 0.58 | 32% | 0.62 | 34% |
| FEV1/FVC: | 28 | 38% | 26 | 36% |
| TLC: | 7.27 | 152% | 6.10 | 126% |
| FRC: | 6.16 | 222% | 4.83 | 174% |
| DLCO: | 8.12 | 51% | 8.91 | 55% |
Lung volumes had been measured by plethysmograph both times and when I looked at the raw test data for both visits, the VTG loops and the SVC maneuvers all appeared to have good quality. Then I looked at the VTG panting frequency however, I immediately saw what was most likely the reason for the change in TLC:
| Jan, 2017 | June, 2016 | |
| Observed: | Observed: | |
| VTG (L): | 6.21 | 4.89 |
| VTG Frequency (pants/min): | 111 | 28 |
So how does the VTG panting frequency affect the TLC?
To be able to explain this you first need to review how lung volumes are measured in a plethysmograph. When a subject sits inside a plethysmograph and the mouthpiece shutter closes, they are supposed to pant (expand and contract their lungs). During this panting maneuver, when the air inside the lungs is compressed, the air inside the plethysmograph is rarified and when the lungs expand, the air inside the plethysmograph is compressed. In both instances, Boyle’s law:
Pressure1 x Volume1 = Pressure2 x Volume2
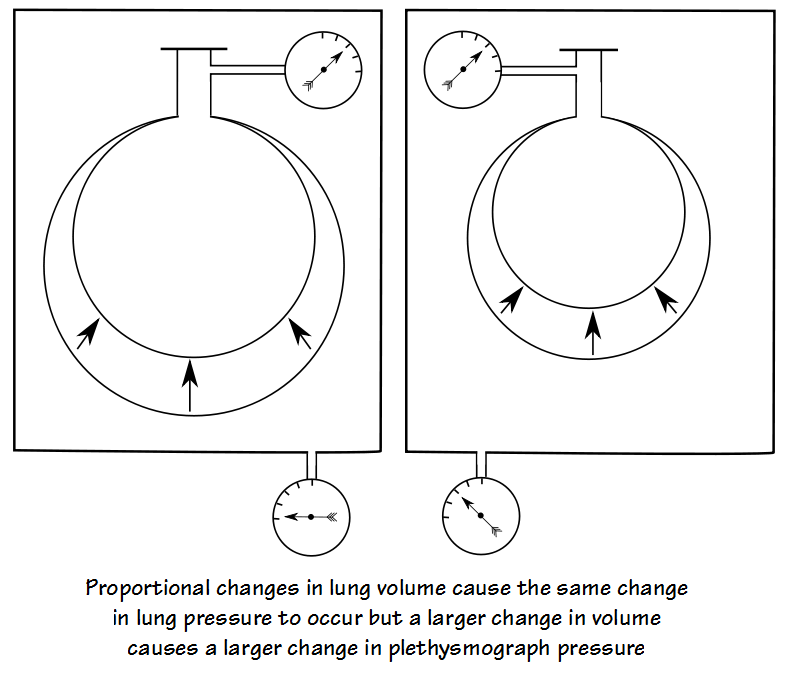
shows that the change in volume and pressure are proportionally related to each other. What this specifically means is that the change in pressure in any given lung is related to its change in volume and for this reason for the same change in pressure a large lung requires a large change in volume and a small lung only requires a small change in volume:

For the air inside the plethysmograph, a small change in lung volume causes a small change in plethysmograph pressure and a large change in lung volume causes a large change in plethysmograph pressure.
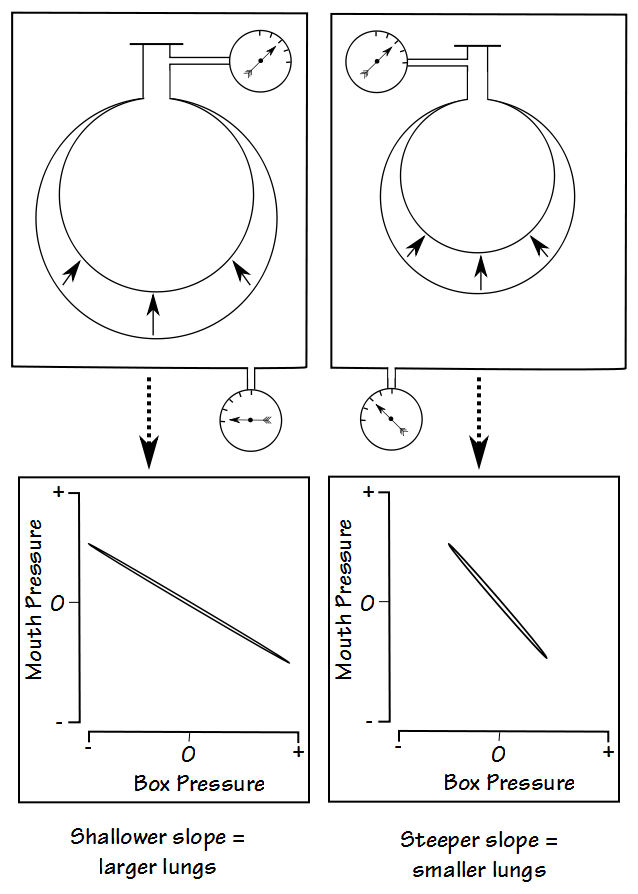
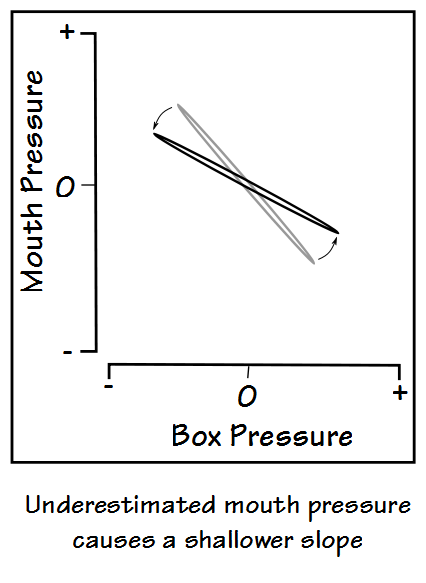
When lung pressure and plethysmograph pressure are plotted against each other, the slope of the line is then proportional to lung volume.
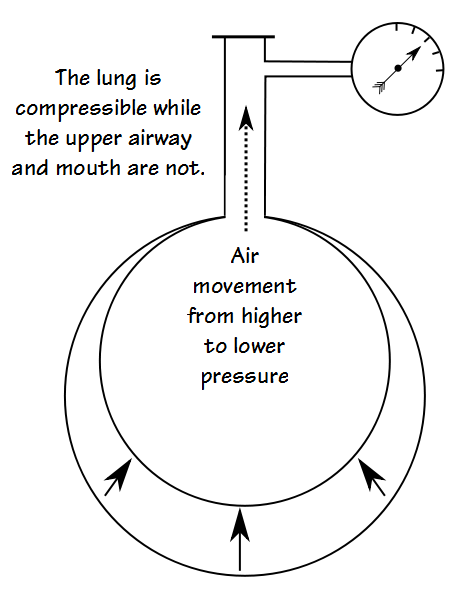
One assumption that this technique makes is that the pressure measured at a subject’s mouth is the same as the pressure inside the lungs. Although mostly true this ignores one small fact and that is while the lungs are compressible (and expandable) the upper airway and mouth are not. What this means is that while the lungs are being compressed (or expanded) air has to move into (or out of) the upper airway and mouth before the pressure measured at the mouth equals the pressure inside the lung.
In most instances the amount of air that has to move is small and this occurs so quickly that panting frequency doesn’t really matter all that much and this effect can be ignored. When there is a great deal of airway obstruction however, airway resistance is high and this can substantially slow the movement of air from the lungs into and out of the mouth.
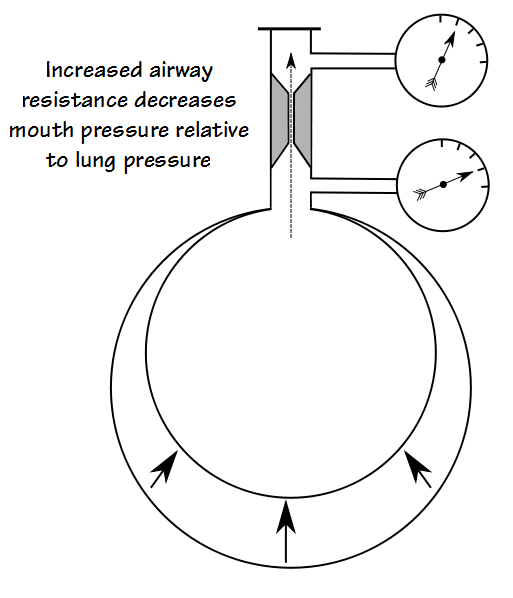
When this happens, the pressure measured at the mouth will be less than the pressure inside the lungs and the slope of mouth vs plethysmograph pressure will be skewed in a way that causes lung volume to be overestimated:
The degree of mismatch between lung pressure and the pressure measured at the mouth depends on the amount of airway resistance and the panting frequency. When airway resistance is high, the panting frequency needs to be low enough for there to be enough time for the pressure in the mouth and the lungs to equalize. It is for this reason that the ATS/ERS standards for plethysmographic lung volume measurements recommend a panting frequency between 30 pants/minute (0.5 Hz) and 60 pants/minute (1.0 hz).
Note: This is also the reason that the subject’s hands are supposed to be placed firmly against their cheeks during the panting maneuver. If the subject’s cheeks are allowed to balloon inwards and outwards during panting then this can also cause mouth pressure to be underestimated relative to lung pressure. I mention this because I’ve talked to a couple patients who had their lung volumes measured in a plethysmograph without being asked to hold their hands against their cheeks (although thankfully not in my lab).
So the VTG panting frequency matters, and in this instance the patient’s change in TLC was most likely related to a change in panting frequency from 28 pants/minute to 111 pants/minute. Although it was a newer staff member that performed this testing I like to spread the pain around equally so I took it as a “teaching moment” and sent an annoying email about this issue to all the lab’s staff and not just that technician.
Accurate lung volume measurement is harder than it looks. There are potential errors in all methods and these errors are often more subtle than they are for spirometry or diffusing capacity. Plethysmographic lung volumes are considered to be the “gold standard”. This is probably because they are supposed to be able to measure “trapped” air that cannot be measured by helium dilution or nitrogen washout. It’s far from clear to me that this is always true and at least one study has shown that the TLC measured by helium dilution more closely approximated that measured by CAT scan volumetry in patients with COPD than did plethysmography. Another study showed that TLC by plethysmography overestimated TLC from CAT scan volumetry in patients with COPD and that the degree of error was related to the severity of airway obstruction.
What is clear however, is that details matter and that plethysmography is as prone to error from poor technique as any other method of measuring lung volumes. So, remember to set your plethysmograph frequency dial to between 0.5 and 1.0 Hz for the highest fidelity in your lung volume measurements.
References:
Bohadana AB, Peslin R, Hannhart B, Tesulescu D. Influence of panting frequency of plethysmographic measurements of thoracic gas volume. J Appl Physiol 1982; 52(3): 739-747.
Borg BM, Thompson BR. The measurement of lung volumes using body plethysmography: a comparison of methodologies. Respir Care 2012; 57(7): 1076-1083.
Brusasco V, Crapo R, Viegi V. et al. Series ATS/ERS task force: Standadisation of lung function testing. Standardisation of the measurement of lung volumes. Eur Respir J 2005; 26: 511-522.
Coates AL, Peslin R, Rodenstein D, Stocks J. ERS/ATS workshop report series. Measurement of lung volumes by plethysmograph. Eur Respir J 1997; 10: 1415-1427.
Criee CP, Sorichter S, Smith HJ et al. Body plethysmography – its principles and clinical use. Respir Med 2011; 105: 959-971.
Garfield JL, Marchetti N, Gaughan JP, Steiner RM, Criner GJ. Total lung capacity by plethysmography and high-resolution computer tomography in COPD. Int J COPD 2012; 7: 119-126.
Nigro CA, Dibur E, Lima S, Giavedoni S, Prieto EJ, Rhodius EE. Overestimation of thoracic gas volume during the airway resistance maneuver. A potential error in the diagnosis of air trapping. Medicina 2004; 64: 31-35.
O’Donnell CR, Bankier AA, Stiebellehner L, Reilly JJ, Brown R, Loring SH. Comparison of plethysmographic and helium dilution lung volumes: which is best for COPD? Chest 2010; 137(5): 1108-1115.
Rodenstein DO, Stanescu DC, Francis C. Demonstration of failure of body plethysmography in airway obstruction. J Appl Physiol 1982; 52(4): 949-954.
Rodenstein DO, Stanescu DC. Frequency dependence of plethysmographic volume in healthy and asthmatic subjects. J Appl Physiol 1983; 54(1): 159-165.
Sue D. Measurement of lung volumes in patients with obstructive lung disease. Ann Amer Thor Soc 2013; 10(5): 525-530.

PFT Blog by Richard Johnston is licensed under a Creative Commons Attribution-NonCommercial 4.0 International License