CPET Test Interpretation, Part 4: Interpretation and Summary

After having gone through the descriptive checklists for ventilatory, gas exchange and circulatory limitations the reason(s) for a patient’s exercise limitation, if any, should be reasonably clear. However, one of the first questions that should be asked when reading an exercise test is what was the purpose of the test?

  • Maximum safe exercise capacity for Pulmonary Rehab?
  • Rule in/rule out exercise-induced bronchospasm?
  • Pre-operative assessment?
  • Dyspnea of uncertain etiology?
  • What is the primary limitation to exercise (pulmonary or cardiac)?
  • Is deconditioning suspected?

The interpretation and summary should address these concerns.

The descriptions checklist is the main groundwork for the actual interpretation and any abnormal findings there may signal the need for specific comments. The interpretation should start by indicating whether or not the patient’s exercise capacity was normal and then should indicate the presence or absence of any limitations.

What was the patient’s maximum exercise capacity (maximum VO2)?

  • >120% = Elevated
  • 80% to 120% = Normal
  • 60% to 79% = Mildly reduced
  • 40% to 59% = Moderately reduced
  • <40% = Severely reduced

Example: There was a {elevated | normal | mildly reduced | moderately reduced | severely reduced} exercise capacity as indicated by the maximum oxygen consumption of XX%.

Continue reading

2019 ATS/ERS Spirometry Standards

The 2019 ATS/ERS Spirometry Standards were recently released. The standards are open-access and can be downloaded without charge from the October 15th issue of the American Journal of Respiratory and Critical Care Medicine. Supplements are available from the same web page.

The 2019 Spirometry Standards have been extensively re-organized with numerous updates. Notably, a number of sections that were previously discussed in the 2005 General Considerations for Lung Function Testing have been updated and included in the 2019 Spirometry Standards. Also notably, a number of stand-alone spirometry tests, including the Flow-Volume Loop, PEF and MVV are not included in the 2019 Standards.

An overview of changes and updates from the 2005 Spirometry Standards are detailed within the 2019 Spirometry Standards (page e71, column 1, paragraph 2) and in the Data Supplement (pages E2-E3). In more detail these include:

◆ The list of indications for spirometry (page e73, table 1) was updated primarily with changes in language.

  • “To measure the effect of disease on pulmonary function” was updated to “To measure the physiological effect of disease or disorder”
  • “To describe the course of diseases that affect lung function” was updated to “To monitor disease progression”
  • “To monitor people exposed to injurious agents” was updated to “To monitor people for adverse effects of exposure to injurious agents”

◆ Items added to indications:

  • “Research and clinical trials”
  • “Preemployment and lung health monitoring for at-risk occupations”

◆ Contraindications were previously mentioned in the 2005 General Considerations rather than the 2005 Spirometry Standards and these have been extensively updated and expanded. Although the list of contraindications (page e74, table 2) is fairly inclusive (and should be reviewed by all concerned) there were items mentioned in the body of text that were not in the table:

  • “Spirometry should be discontinued if the patient experiences pain during the maneuver.”
  • “…because spirometry requires the active participation of the patient, inability to understand directions or unwillingness to follow the directions of the operator will usually lead to submaximal test results.”

◆ Notably, abdominal aortic aneurysm (AAA) was not included as a contraindication in the 2019 standards. (page e72, column 3, paragraph 1)

Continue reading

CPET Test Interpretation, Part 3: Circulation

I would like to re-emphasize the importance of the descriptive part of CPET interpretation. At the very least consider it to be a checklist that should always be reviewed even when you think you know what the final interpretation is going to be.

After gas exchange, the next step in the flow of gases is circulation. The descriptive elements for assessing circulation are:

What was the maximum heart rate?

The maximum predicted heart rate is calculated from 220 – age.

A maximum heart rate above 85% of predicted indicates that there has been an adequate exercise test effort.

Example: The maximum heart rate was XX% of predicted {which indicates an adequate test effort}.

What was the heart rate reserve?

The heart rate reserve is (predicted heart rate – maximum heart rate). A heart rate reserve that is greater than 20% of the (predicted heart rate – resting heart rate) is elevated and may be an indication of either chronotropic incompetence or an inadequate test effort.

Note: A negative heart rate reserve will occur whenever a patient exceeds their predicted heart rate.

Example: The heart rate reserve is XX BPM which is {within normal limits | elevated}.

Continue reading

CPET Test Interpretation, Part 2: Gas Exchange

I would like to re-iterate the importance of the descriptive part of CPET interpretation. At the very least consider it to be a checklist that should always be reviewed even when you think you know what the final interpretation is going to be.

After ventilation, the next step in the flow of gases is gas exchange. The descriptive elements for assessing gas exchange are:

What was the maximum oxygen consumption (VO2)?

The maximum oxygen consumption is the prime indicator of exercise capacity. Predicted values should be based on patient height, age, weight and gender.

Note: There is actually a surprising limited number of reference equations for maximum VO2. The only one I’ve found that takes weight into consideration in a realistic manner is Wasserman’s algorithm. Some test systems do not offer this reference equation but I feel it is worthwhile for it to be calculated and used regardless. See appendix for the algorithm.

Note: The maximum VO2 does not necessarily occur at peak exercise (i.e. test termination). This can happen in various types of cardiac and vascular diseases but also because the patient may decrease the level of their exercise before the test is terminated.

  • Maximum VO2 > 120% of predicted = Elevated
  • Maximum VO2 = 80% to 119% of predicted = Normal
  • Maximum VO2 = 60% to 79% of predicted = Mild impairment
  • Maximum VO2 = 40% to 59% of predicted = Moderate impairment
  • Maximum VO2 < 40% of predicted = Severe impairment

Example: The maximum VO2 was X.XX LPM { which is {mildly | moderately | severely } decreased | within normal limits | elevated}.

Continue reading

CPET Test Interpretation, Part 1: Ventilatory response

I’ve always found interpreting CPET tests to be one of the more interesting (and enjoyable) things I’ve done. Interpreting a CPET test is both more difficult and easier than interpreting regular PFTs. More difficult because there are a lot more parameters involved and easier because determining test adequacy and the primary cause(s) of an exercise limitation tends to be clearer.

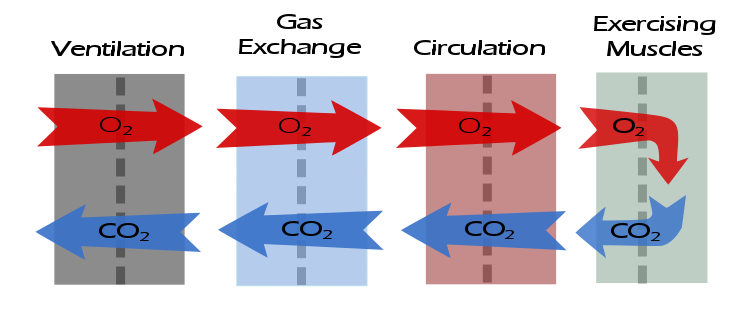
I’ve found that you have to go back to basic physiology whenever you interpret CPETs and that always boils down to the flow of oxygen and carbon dioxide.

Abnormalities in gas flow that occurs at any of these steps will leave a distinctive pattern in the test results. I’ve developed a structured approach to interpreting CPET results that includes a descriptive part as well as the interpretation and summary. The descriptive part may appear to be tedious but I’ve always found it to be absolutely critical to the actual interpretation.

The descriptive elements for assessing the ventilatory response to exercise are:

What was the baseline spirometry?

Note: Spirometry pre- and post-exercise should always be performed as part of a CPET, even when exercise-induced bronchoconstriction is not suspected. This is so that normal values for the ventilatory response to exercise can be determined.

Example: The FVC was {normal | mildly reduced | moderately reduced | moderately severely reduced | very severely reduced}. The FEV1 was {normal | mildly reduced | moderately reduced | moderately severely reduced | very severely reduced}. The FEV1/FVC ratio was was {normal | mildly reduced | moderately reduced | severely reduced}.

What was the post-exercise change in FEV1?

A decrease in FEV1 ≧ 15% following exercise is abnormal and suggests exercise-induced bronchoconstriction.

Note: FEV1 can increase post-exercise and an increase up to 5% is normal. Some patients with reactive airway disease bronchodilate with exercise and can an increase ≧ 15% from baseline, particularly if they were obstructed to begin with. Although strictly speaking this is not abnormal, it does suggest the presence of labile airways.

Example: There was {a significant decrease / no significant change / a significant increase} in FEV1 following exercise.

Continue reading

FEV1 and VC should be measured separately

The FEV1 and VC both provide quite different information about a patient’s lungs. Unfortunately, spirometry as it is currently practiced is optimized towards generating an accurate FEV1 more than an accurate VC. This is partly due to limitations in the maneuver itself and partly due to the lack of accurate end-of-test criteria for an adequate VC. In one sense this is okay since more than one person that I’ve known and respected has said that “it’s all about the FEV1”.

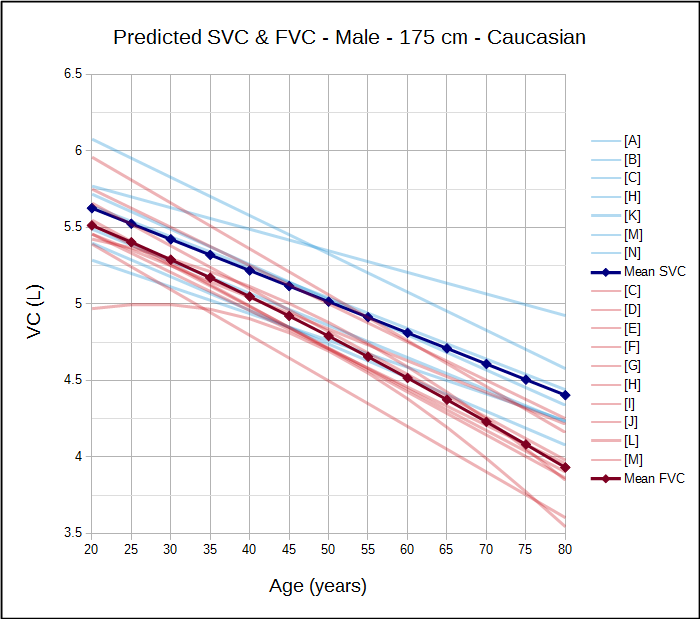
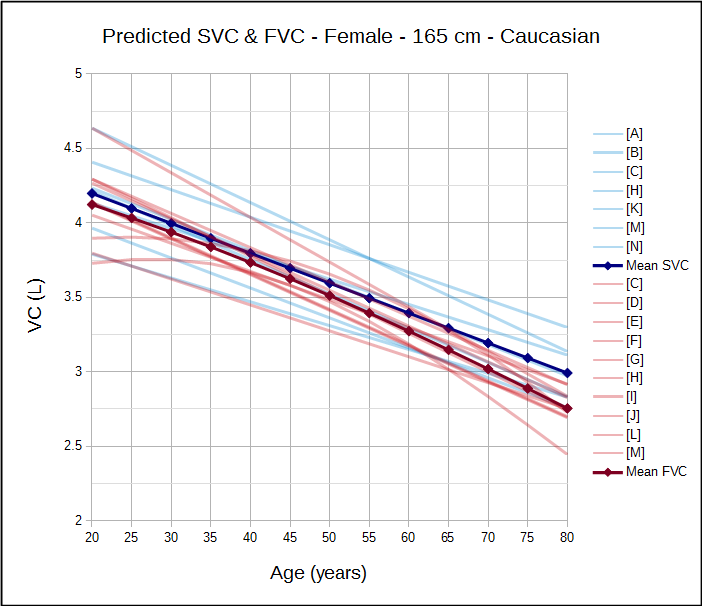
Having said that, an accurate FEV1/VC ratio is essential for detecting and quantifying airway obstruction and an SVC maneuver is more likely to obtain a more accurate VC. This matters because the current ATS/ERS spirometry guidelines recommend that the FEV1/VC be reported, where the VC is the largest value obtained from any test and reference equations indicate that the SVC is routinely larger than the FVC:

So, shouldn’t we be routinely performing both FVC and SVC maneuvers when we do spirometry on our patients? And why aren’t we?

Continue reading

A modest proposal for a clinical spirometry grading system

A while back I reviewed the spirometry grading system that was included in the 2017 ATS reporting standards. My feeling was, and continues to be, that its usefulness is very limited because it’s mostly a reproducibility grading system that relies on a few easy-to-measure parameters. This doesn’t mean that a grading system can’t be helpful, just that it needs to be focused differently.

In a clinical PFT lab many patients have difficulty performing adequate and reproducible spirometry, but that doesn’t mean the results aren’t clinically useful. Moreover, suboptimal quality results may be the very best the patient is ever able to produce. So what’s more important in a grading system than reproducibility is the ability to assess the clinical utility of a reported spirometry effort.

The two most important results that come from spirometry are the FEV1 and the FVC, and I strongly believe that they need to be assessed separately. For each of these values there are two aspects that need to be determined. First, is there a reliable probability that the reported value is correct? Second, are any errors causing the reported value to be underestimated or overestimated? The two are inter-related since a value with excellent reliability is not going to have any significant errors, but if there are errors then a reviewer needs to know which direction the result is being biased.

The current ATS/ERS standards contain specific thresholds for certain spirometry values such as expiratory time and back-extrapolation. Although these are certainly indications of test quality they are almost always used in a binary [pass | fail] manner. In order to assess clinical usefulness however, you instead need to grade these on a scale. For example an expiratory time of 5.9 seconds for spirometry from a 60 year-old individual would mean that there is a small probability that the FVC is underestimated, but with an expiratory time of 1.9 seconds the FVC would have a very high probability of being underestimated and this needs to be recognized in order to assess clinical utility.

Note: Although the A-B-C-D-F grading system is rather prosaic it is still universally understandable, so I will use it for grading reliability. An A grade or an F grade are probably easy to assign but differentiating between B-C-D may be more subjective, particularly since reliability depends on multiple parameters and judging their relative contribution is always going to be subjective at some point. For bias, I will be using directional characters (↑↓) to show the direction of the bias (i.e. positive or negative), so ↑ will indicate probable overestimation, ↓ will indicate probable underestimation, and ~ indicates a neutral bias.

FEV1 / Back extrapolation:

Back-extrapolation is a way to assess the quality of the start of a spirometry effort and the accuracy of the timing of the FEV1. The ATS/ERS statement says that the back-extrapolated volume must be less that 5% of the FVC or less than 0.150 L, whichever is greater.
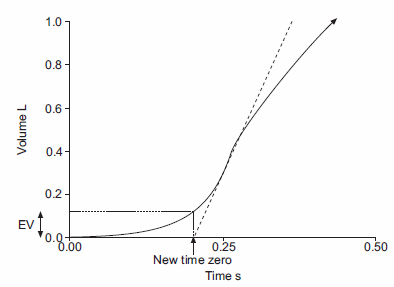
My experience is that an elevated back-extrapolation tends to cause FEV1 to be overestimated far more often than underestimated. So a suggested grading system for back-extrapolation would be (and I’ll be the first to admit these are off the top of my head and open for discussion):

FEV1:    
Back-Extrapolation: Reliability: Bias:
Within standards: A ~
> 1 x standard, < 1.5 x standard: B
> 1.5 x standard, < 2 x standard C ↑↑
> 2 x standard, < 2.5 x standard: D ↑↑↑
> 2.5 x standard F ↑↑↑↑

Continue reading

Infection Control

The issue of infection control has been a topic of a couple of discussions I’ve had lately. In particular, it was reported to me that a PFT lab had come under fire from a Joint Commission inspector who did not believe that filter mouthpieces were adequate and that “patient valves and circuits need to be sterilized between each patient”.

Unfortunately with all the other things we have to worry about it’s all too easy to become blasé about infection control. This despite the fact that every hospital I’ve visited in the last dozen or so years has posted numerous signs about hand washing and the safe disposal of contaminated supplies. But maybe it’s because we’re inundated with reminders that we’ve developed a blind spot about it.

The 2005 ATS/ERS statement on general considerations has two pages devoted to infection control (pages 155-157). The ATS procedure manual also has four pages devoted to infection control (pages 34-38), although much of this is devoted to a discussion of tuberculosis, cystic fibrosis and sterilization procedures. Of necessity, the ATS/ERS statement and ATS procedure manual discuss infection control in generalities and any given lab will need to have a policy tailored for their specific circumstances. Even so, either or both of these (as well as Kendrick et al’s 2003 review) should be the basis for your lab’s policy on infection control (and you do have one, don’t you?).

So what are the issues?

Diseases can be transmitted by direct contact (saliva) or indirect contact (airborne particles). PFT Labs need to prevent cross-transmission of diseases by the use of barrier devices (gloves, filter mouthpieces) and proper cleaning procedures.

So yeah, it’s as simple as that, but as usual the devil is in the details and in particular there are trade-offs between expense, time and efficacy. Continue reading

A spirometry quality grading system. Or is it?

A set of guidelines for grading spirometry quality was included with the recently published ATS recommendations for a standardized pulmonary function report. These guideline are similar to others published previously so they weren’t a great surprise but as much as I may respect the authors of the standard my first thought was “when was the last time any of these people performed routine spirometry?” The authors acknowledge that the source for these guidelines is epidemiological and if I was conducting a research study that required spirometry these guidelines would be useful towards knowing which results to keep and which to toss but for routine clinical spirometry, they’re pretty useless.

I put these thoughts aside because I had other projects I was working on but I was reminded of them when I recently performed spirometry on an individual who wasn’t able to perform a single effort without a major errors. The person in question was an otherwise intelligent and mature individual but found themselves getting more frustrated and angry with each effort because they couldn’t manage to perform the test right. I did my best to explain and demonstrate what they were supposed to do each time but after the third try they refused to do any more. About the only thing that was reportable was the FEV1 from a single effort.

This may be a somewhat extreme case but it’s something that those of us who perform PFTs are faced with every day. There are many individuals that have no problems performing spirometry but sometimes we’re fortunate to get even a single test effort that meets all of the ATS/ERS criteria. The presence or absence of test quality usually isn’t apparent in the final report however, and for this reason I do understand the value in some kind of quality grading system. But that also implies that the grading system serves the purpose for which it is intended.

In order to quantify this I reviewed the spirometry performed by 200 patients in my lab in order to determine how many acceptable and reproducible results there were. To be honest, as bad as I thought the quality problem was, when I looked at the numbers it was worse than I imagined.

The spirometry quality grading system is:

Grade: Criteria:
A ≥3 acceptable tests with repeatability within 0.150 L (for age 2–6, 0.100 L ), or 10% of highest value, whichever is greater
B ≥2 acceptable tests with repeatability within 0.150 L (for age 2–6, 0.100 L ), or 10% of highest value, whichever is greater
C ≥2 acceptable tests with repeatability within 0.200 L (for age 2–6, 0.150 L ), or 10% of highest value, whichever is greater
D ≥2 acceptable tests with repeatability within 0.250 L (for age 2–6, 0.200 L ), or 10% of highest value, whichever is greater
E 1 acceptable test
F No acceptable tests

Continue reading

ERS/ATS 2017 DLCO standards

The new ERS/ATS standards for DLCO testing were published in the January issue of the European Respiratory Journal. The article was published as open access and can be downloaded from the ERJ website.

The biggest difference between the new standards and those from 2005 is that they are now primarily oriented towards Rapid-response Gas Analyzers (RGA). The authors explicitly state that the new standards do not make older systems that use discrete alveolar sampling and slower gas analyzers obsolete, but many of the new suggestions and requirements for labs and manufacturers require systems with a RGA.

The differences between the 2017 and 2005 standards that I’ve been able to find include:

♦ Flow accuracy was not specified in the 2005 standard but is now required to be ± 2% over a range of ± 10 L/sec.

♦ Volume accuracy is now required to be ± 2.5% (± 75 ml) instead of ± 3.5%. Notably the 2005 standard included a ± 0.5% error in the calibrating syringe. The accuracy of the 3-liter syringe is now stated separately. In the 2005 standard volume accuracy was over an 8-liter range. No volume range is specified in the 2017 standard.

♦ RGA response time (analyzer rise time) had not previously been specified but is now required to be ≤150 milliseconds. Sample transit time was discussed but no specific recommendations were made. Sample transport issues such as Taylor dispersion, gas viscosity and turbulence at gas fittings was also discussed and although it was suggested that manufacturers attempt to minimize these effects no specific recommendations were made.

♦ Analyzer linearity for both RGA and discrete sample systems has been relaxed to ± 1.0% in the 2017 standards from ± 0.5% in the 2005 standards.

♦ CO analyzer accuracy for both RGA and discrete sample systems is now specified as ≤10 ppm (which is ±0.3% of 0.3% CO). It was previously specified as ± 0.0015% (which is ± 0.5% of 0.3% CO).

♦ Interference from CO2 and water vapor for both RGA and discrete sample systems is now specified as ≤10 ppm error in CO (when CO2 and water vapor are ≤5%). Interference was recognized as a problem in the 2005 standard but error limits were not specified.

♦ Digital sampling rate was not discussed or specified in the 2005 standards. It is now specified as a minimum of ≥100 hz with a resolution of 14 bits. A 1000 hz sampling rate is recommended.
Continue reading