I would like to re-iterate the importance of the descriptive part of CPET interpretation. At the very least consider it to be a checklist that should always be reviewed even when you think you know what the final interpretation is going to be.
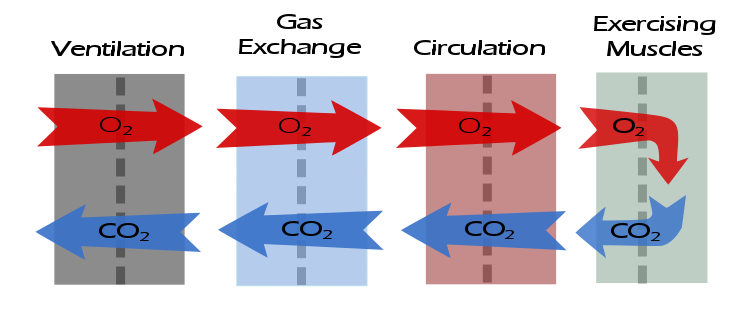
After ventilation, the next step in the flow of gases is gas exchange. The descriptive elements for assessing gas exchange are:
What was the maximum oxygen consumption (VO2)?
The maximum oxygen consumption is the prime indicator of exercise capacity. Predicted values should be based on patient height, age, weight and gender.
Note: There is actually a surprising limited number of reference equations for maximum VO2. The only one I’ve found that takes weight into consideration in a realistic manner is Wasserman’s algorithm. Some test systems do not offer this reference equation but I feel it is worthwhile for it to be calculated and used regardless. See appendix for the algorithm.
Note: The maximum VO2 does not necessarily occur at peak exercise (i.e. test termination). This can happen in various types of cardiac and vascular diseases but also because the patient may decrease the level of their exercise before the test is terminated.
- Maximum VO2 > 120% of predicted = Elevated
- Maximum VO2 = 80% to 119% of predicted = Normal
- Maximum VO2 = 60% to 79% of predicted = Mild impairment
- Maximum VO2 = 40% to 59% of predicted = Moderate impairment
- Maximum VO2 < 40% of predicted = Severe impairment
Example: The maximum VO2 was X.XX LPM { which is {mildly | moderately | severely } decreased | within normal limits | elevated}.
What was the maximum oxygen consumption in ml/kg/min?
This value is affected by a patient’s BMI and for this reason may have a limited value in assessing a patient’s exercise capacity but despite this it has been used extensively in disability and pre-operative assessments. Underweight patients may have an elevated VO2 in ml/kg/min and overweight patients may have a reduced VO2 in ml/kg/min even when VO2 expressed a LPM is normal.
- VO2 < 10 ml/kg/min: Surgery is contraindicated.
- VO2 = 10 to 15 ml/kg/min: Unable to perform most jobs; at increased risk for invasive surgical procedures.
- VO2 = 15 to 25 ml/kg/min: Able to work at jobs that do not require extended work above 40% of maximum VO2; surgical risk is low.
- VO2 > 25 ml/kg/min: Able to perform most jobs.
Example: The maximum VO2 was XX ml/kg/min.
Was there a VO2 plateau?
A VO2 plateau is defined as a stable, unchanging VO2 for > 1 minute, particularly while the work rate is still increasing. When present it suggests the patient has achieved their maximum cardiac output. It can also occur in patients being exercised at very low work loads.
Note: When looking at raw test data, a VO2 plateau should be accompanied by an increase in Minute Ventilation (Ve) and CO2 production (VCO2). If these do not continue to increase then the VO2 plateau is more likely due to the patient slowing down and exercising less than it is to a true VO2 plateau.
Example: {There was no VO2 plateau. | There was a VO2 plateau occurring during the final XX seconds of testing.}
What was the Oxygen Saturation (SaO2) at rest and at maximum exercise?
A resting SaO2 < 95% is abnormal. A decrease in SaO2 during exercise ≧ 3% is abnormal.
Note: Oximeter readings can be inaccurate at high heart rates, from motion artifact or poor peripheral circulation.
Note: In an adequate test, a significant decrease in SaO2 indicates that the primary exercise limitation is pulmonary (either ventilatory or vascular) while a normal SaO2 indicates that the primary limitation is cardiac. This is discussed in greater detail in the previous posting DLCO/Qc, SaO2 and CPETs.
Example: The baseline SaO2 was {reduced | normal}. There was {no} significant desaturation {to XX%} during exercise.
What was the maximum PetCO2?
End-tidal CO2 (PetCO2) is an indirect measurement of ventilatory efficiency and is the product of PACO2 and ventilation. Although PetCO2 at rest is approximately 2 mm Hg below PaCO2 the relationship between PetCO2 and PaCO2 is much less exact during exercise and will be overridden by an exaggerated ventilatory response to exercise. PetCO2 should rise during exercise and peak near AT, then decrease until maximum exercise is attained with a further drop following exercise.
Note: PetCO2 during exercise was discussed in greater detail in the previous posting PetCO2 during exercise, a quick diagnostic indicator.
An arbitrary grading scale for maximum PetCO2 is:
- ≧ 35 = normal
- 30 to 35 = mildly reduced
- 25 to 30 = moderately reduced
- <25 = severely reduced
Example: The maximum PetCO2 was XX mmHg which is {normal | {mildly | moderately | severely reduced}}.
What was the RER pattern during exercise?
The Respiratory Exchange Ratio (RER) is VCO2/VO2. A normal resting value is 0.70 to 0.90 and is influenced by diet (lower with a high protein diet, higher with a high carbohydrate diet). RER usually falls below the baseline value at the beginning of exercise (due to a delay in VCO2 kinetics) and then increases thereafter.
An RER of 1.10 or higher at peak exercise is an indicator of an adequate exercise test effort.
Note: Patients exercising on a treadmill have a greater difficulty in achieving an RER of 1.10 and for this reason an RER of 1.05 is likely an indication of an adequate test.
Note: When elevated at rest (>1.00) this often means nothing more than patient anxiety. If the RER is elevated at rest and does not decrease below 1.0 during the first level of exercise this suggests a metabolic disorder or continued hyperventilation.
Example: The RER was X.XX at peak exercise {which indicates an adequate exercise test effort}.
What was the Ve/VCO2 at Anaerobic Threshold (AT)?
Ve/VCO2 is the amount of ventilation required per unit of CO2 production. High values suggest inefficient ventilation either due to ventilatory or gas exchange causes. Ve/VCO2 tends to be elevated at rest (40-50), decreases to minimum value at or shortly after AT, and can then increase or remain flat to peak exercise.
A Ve/VCO2 > 35 at AT is likely abnormal and raises the question of pulmonary vascular disease or hyperventilation.
Note: A diagnosis of pulmonary vascular disease needs a significant decrease in SaO2 and/or a reduced DLCO for confirmation.
Example: The Ve/VCO2 at AT was XX which is {within normal limits | elevated}.
What was the lowest observed Ve/VCO2?
Anaerobic threshold is a somewhat arbitrary point for the assessment of Ve/VCO2. This is because the nadir in Ve/VCO2 usually occurs following the nadir in Ve/VO2 which is a primary marker for the AT. For the reason the lowest observed Ve/VCO2 may be a more accurate reflection of ventilatory efficiency.
A lowest observed Ve/VCO2 > 35 is likely abnormal.
Example: The lowest observed Ve/VCO2 was XX which is {within normal limits | elevated}.
What was the Ve-VCO2 slope to AT?
The Ve-VCO2 slope is determined using linear regression when Ve is plotted versus VCO2 and like the Ve/VCO2 is a way to measure the efficiency of gas exchange. The Ve-VCO2 slope is usually calculated from rest to AT, but peak exercise values can be substituted when a patient is unable to reach AT or AT is indeterminate. This is discussed in more detail in the previous posting Ve-VCO2 slope: Just to AT or all the way to peak?
Note: My personal opinion is that the Ve-VCO2 slope is a more accurate reflection of ventilatory efficiency than Ve/VCO2 and this is because it is based on a majority of the VCO2 and Ve measurements rather than just a few. However, many test systems do not calculate Ve-VCO2 slope and if needed it must be calculated manually (spreadsheet actually, with manual entry).
A Ve-VCO2 slope to AT > 34 is abnormal and carries an increased risk for surgical procedures.
Example: The Ve-VCO2 slope to AT was XX which is {within normal limits | elevated}.
What was the Ve-VCO2 slope to peak exercise?
The AHA recommends calculating the Ve-VCO2 slope from rest to peak exercise, rather than just to AT.
A Ve-VCO2 slope to peak exercise < 30 is considered normal. A Ve-VCO2 slope to peak exercise > 40 is considered abnormal.
Note: The Ve/VCO2 slope to peak exercise is highly dependent on how far a patient is willing to push themselves. An early termination will reduce the peak Ve-VCO2 slope. This is discussed in more detail in the previous posting Ve-VCO2 slope: Just to AT or all the way to peak?
Example: The Ve-VCO2 slope to peak exercise was XX which is {within normal limits | elevated}.
After having gone through this checklist it should be apparent whether the gas exchange response to exercise was normal or abnormal, and as importantly, specifically which element was normal or abnormal.
A gas exchange defect will be indicated by a reduced maximum oxygen consumption, inefficient ventilation and, in more severe cases, a significant decrease in SaO2. These findings are not specific to obstructive (COPD, not asthma) or restrictive diseases. Even patients with normal lung mechanics can have limitations in gas exchange, a prime example of this being a pulmonary emboli. Elevations in Ve/VCO2 and Ve-VCO2 slope are also frequently seen in cardiac disease
It should also be apparent that it is necessary to review all of the raw test data, not just that presented for baseline, AT and peak exercise. Summary reports automatically generated by test systems often have inaccuracies in how test data is selected and averaged and these reported results should always be verified.
As always however, attention should be paid to test quality as suboptimal testing can skew results.
Next: CPET Interpretation part 3: Cardiovascular response to exercise
Previous: CPET interpretation part 1: Ventilatory response to exercise
Appendix: Wasserman’s VO2 calculation algorithm
Male:
Cycle factor = 50.72 – (3.72 x age)
Predicted weight (kg) = (0.79 x height (cm)) – 60.7
If actual weight = predicted weight then:
VO2 (ml/min) = Actual weight x cycle factor
If actual weight < predicted weight then:
VO2 (ml/min) = ((Predicted weight + actual weight) / 2) x cycle factor
If actual weight > predicted weight then:
VO2 (ml/min) = (predicted weight x cycle factor) + (6 x (actual weight – predicted weight))
If treadmill is used rather than a bicycle ergometer then multiply VO2 by 1.11
Female:
Cycle factor: 22.78 x (0.17 x age)
Predicted weight (kg) = (0.65 x height (cm)) – 42.8
If actual weight = predicted weight then:
VO2 (ml/min) = (actual weight (kg) + 43) x cycle factor
If actual weight < predicted weight then:
VO2 (ml/min) = ((predicted weight + actual weight + 86) / 2) x cycle factor
If actual weight > predicted weight then:
VO2 (ml/min) = ((predicted weight + 43) x cycle factor) + (6 x (actual weight – predicted weight))
If treadmill is used rather than a bicycle ergometer then multiply VO2 by 1.11
Note: Wasserman et al does not specify over what range an actual weight should be considered the same as the predicted weight (particularly since they are very rarely if ever identical). As a rule of thumb I use +/- 10% as an acceptable “normal” range.
References:
Balady GJ; et al. Clinician’s guide to cardiopulmonary exercise testing in adults: A scientific statement from the American Heart Association. Circulation 2010; 122: 191-225.
Wasserman K, Hansen JE, Sue DY, Stringer WW, Whipp BJ. Principles of exercise testing and interpretation, 4th edition, page 166. Lippincott, Williams and Wilkins, publisher.

PFT
Blog by Richard
Johnston
is
licensed under a Creative
Commons Attribution-NonCommercial 4.0 International License.