Inspiratory and expiratory flow rates are a function of driving pressure (i.e. the pressure difference between the alveoli and the atmosphere) and airway resistance. For this reason it would seem that airway resistance should be one of the most commonly performed pulmonary function tests but instead it is the outcome of airway resistance and driving pressure, i.e. the expiratory and inspiratory flow rates that are measured almost exclusively. One reason for this is that resistance measurements requires relatively expensive equipment such as a body plethysmograph or an impulse oscillometer as well as a fair amount of technical expertise.
The airflow perturbation device (APD) is a potentially inexpensive system for measuring respiratory resistance during tidal breathing. The device itself is mechanically simple, the concepts and mathematics that permit it to work are, however, a bit more complicated.
The APD consists of a mouth pressure transducer and a pneumotach whose end is attached to a rotating wheel. The wheel has open segments and segments with a mesh that partially obstructs airflow through the pneumotach. The rotation of the wheel causes a series of perturbations to the airflow through the pneumotach.
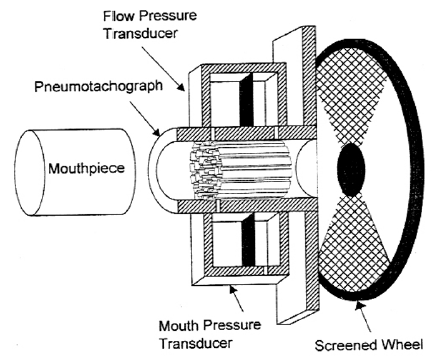
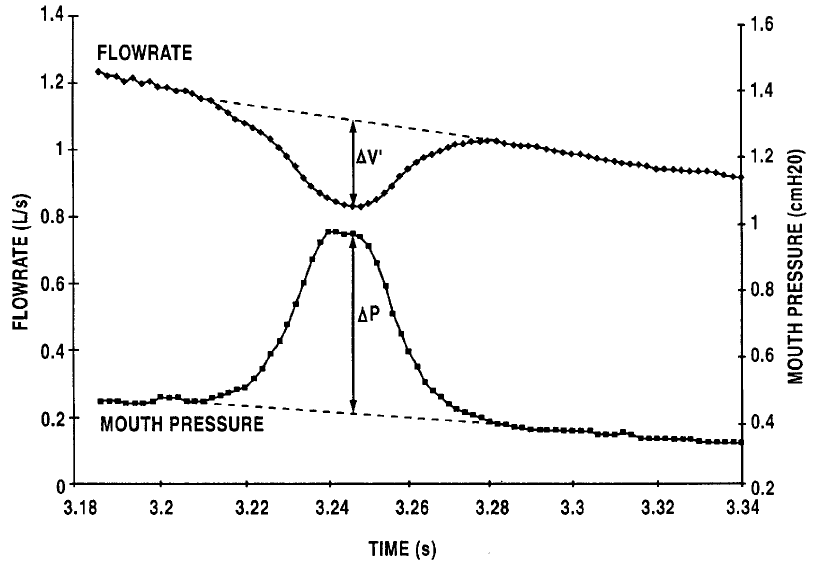
When the mesh obscures the airflow, mouth pressure rises and the flow rate decreases.
US Patent 6066101
In some senses this is similar to occlusion resistance measurements (ROCC) however, airflow is not occluded abruptly, it instead diminishes steadily (the developers suggest that airflow should be reduced no more than 30%) and then increases steadily as the section of the wheel with the resistance rotates past the pneumotach.
The system software uses linear interpolation using the pre- and post-perturbation flow and mouth pressure to determine what the developers call “virtual” data. Using the “virtual” and “real” data the changes in flow and mouth pressure (∆flow and ∆pressure) that occur during a perturbation are calculated. These measurements are averaged over approximately 100 perturbations before resistance is actually calculated.
From US Patent 6066101
The calculations start with a formula that describes the respiratory system:
![]()
Where:
Pmuscle = respiratory muscle pressure
Pmouth = mouth pressure
Cresp = respiratory compliance
V = lung volume
Rresp = respiratory resistance
V’ = flow rate
Iresp = respiratory inertance
V’’ = volume acceleration
The developers note that the effects of inertance (inertia) during tidal breathing is very small and that volume acceleration is zero at peak perturbation. In addition both “real” and “virtual” compliances and lung volumes is identical during a perturbation. For these reasons the formula can (eventually and after a number of intermediate steps) be simplified and re-written as:
![]()
Research with Forced Oscillation has shown that respiratory resistance is frequency dependent and decreases significantly from 0 hz to 2 hz and then remains flat up to about 10 hz. The wheel rotation rate of the most recent version of the APD is set to provide approximately 10 perturbations/second. Experimentally frequencies of 2.2 hz, 4.4 hz, 6.7 hz have been tested and the measured resistance was not significantly different for any of these rotation rates.
In a study with a small number (7) of subjects APD measurements were shown to be highly repeatable with an intrasession coefficient of variability (COV) of 4.0%. Day to day results actually showed lower variability (COV 1.8%) but repeatability over a longer time period (week to week) was somewhat poorer (COV 7.2%) but given the small sample size this may also be due to actual changes in resistance over that period.
One advantage of the APD is that it is able to differentiate between inspiratory and expiratory resistance. Another is that it is able to tolerate small to moderate leaks around the mouthpiece without substantially affecting the results although subjects are usually expected to breathe on the APD using a mouthpiece and noseclips. In one study the APD was been used with a oronasal mask to determine nasal resistance. The same study showed no significant difference in respiratory resistance when mouth breathing (with nasal passages were occluded) using the mask was compared to breathing through a mouthpiece.
The APD has been tested with experimentally induced vocal cord dysfunction and showed changes in resistance that correlated well with glottal area as measured by a laryngoscope. The APD has also been used during exercise which may be useful for assessing exercise-induced bronchospasm and exercise-induced vocal cord dsyfunction although doing this precludes the simultaneous measurement of ventilation and gas exchange.
One study showed that the resistance measured by plethysmograph was lower than that measured by APD. Specifically a group of 20 subjects had a range of 0.45 to 1.39 cmH2O L/sec by plethysmography and a range of 2.17 to 3.90 cmH20/L/sec for average resistance by APD. A larger study of 272 patients routinely referred to a pulmonary function lab was different and showed an average APD resistance of 3.0 cmH2O/L/sec versus 3.3 cmH2O/L/sec for plethysmography. Although statistically there is little difference between these two values the scatter is actually quite large which calls into question the statistical relevance of the averaged values.
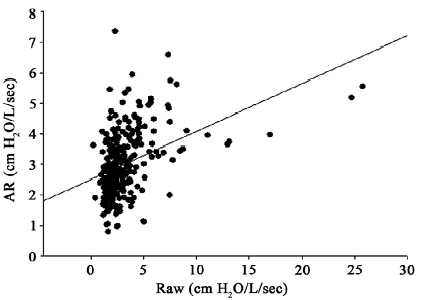
From Open J Respir Dis 2013; 3: page 66
Plethysmographic and APD resistances are expected to be different however, and that is because there are airway, lung tissue and chest wall components to resistance. The resistance measured in a plethysmograph is considered to be primarily airway resistance. Airway and lung tissue resistance (pulmonary resistance) can be measured by techniques that use an esophageal balloon. Impulse Oscillometry (IOS) and the APD measure a combination of airway, lung tissue and chest cage resistance which is considered to be respiratory resistance.
Even though both APD and IOS both measure respiratory resistance and a study with 10 healthy subjects performing both IOS and APD showed a highly linear correlation between the two, there was also a systematic difference in the results with the APD resistance being on average 1.29 times larger than the IOS P5 (5 hz) resistance. The reason for this systematic difference is unclear. Using a physical model with calibrated resistances the researchers noted that IOS underestimated and APD overestimated the actual resistance and speculated that this may be due in part to differences in compliance.
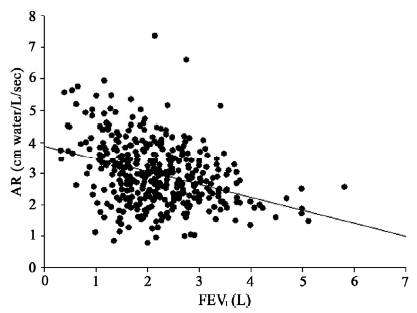
Despite the number of years that the APD has been around in one form or another (it was originally described in 1974, originally patented in 1980 and re-patented in 2000), there is little information about its clinical utility. In the previously mentioned study of 272 patients routinely referred for pulmonary function testing the correlation between FEV1 and APD resistance was low. Moreover when FEV1 and APD resistance were graphed against each other the point scatter was quite large.
From Open J Respir Dis 2013; 3: page 66
It should be noted that in the same study RAW measured by plethysmograph also had a low correlation with FEV1 (although slightly higher than the APD) and to some extent this is one of the problems with resistance regardless of how it is measured. Even though the FEV1 and RAW are interrelated the fact that they are measuring different things and are dependent on different factors has been pointed out by numerous researchers.
In addition even though the plethysmographic measurement of RAW was first described in 1956 the interpretation of RAW is far from straightforward and this is because it is dependent on both lung volume and the frequency it is measured at. This is the reason that sRAW, GAW and sGAW are often included in the reported results, but it also has made understanding their meaning and significance more difficult.
My personal experience has been that RAW measurements have a high degree of variability within any given individual and the selection of specific test results influences the reported RAW. Although there are quality indicators for RAW maneuvers these are often hard to apply (in particular my lab software does not let us select separate resistance slopes for inspiration and expiration) and I suspect that this may bias the way in which results are reported.
IOS systems have also been around for decades and although they have made some inroads into routine clinical testing a recent discussion of IOS on the AARC diagnostics forum indicates that many labs have abandoned their use, most often because their physicians don’t know how to interpret the results. In large part I think the reason for this it that technical discussions of oscillometry (and for that matter the airflow perturbation device) are often presented using the terminology of electrical circuitry (resistance, inductance, capacitance and impedance). This is because the mathematics that underlies these terms both electrically and physiologically are essentially identical. Having had some education in electronics I can follow these discussions to some extent (although I’ll be the first to admit I have to work at it in order to follow certain arguments) but at the same time I think that these descriptions and explanations are disconnected from the standard terminology of pulmonary physiology and this tends to make it difficult to understand them.
The APD is an interesting approach towards measuring respiratory resistance. It is certainly easier to use and would probably be much less expensive than plethysmography and IOS systems. There is also some reason to believe that APD results would be more reproducible and have less selection bias than RAW measurements. I have some reservation about the simplification of the mathematics that underpins the APD and about its use for anything other than quiet tidal breathing but the real problem the developers of the APD face is proving its clinical relevance. In particular unless they can show that it has some utility in diagnosing and managing pulmonary disorders in a way that cannot be performed by spirometry it is unlikely it will ever come into common use.
References:
Dubois AB, Botelho SY, Comroe JH: A new method for measuring airway resistance in man using a body plethysmograph: values in normal subjects and in patients with respiratory disease. J Clin Invest 1956; 35(3): 327-335
Johnson AR, Chapain P, Slaughter D, Gallena S, Vossoughi J. Inspiratory and expiratory resistances during exercise. Brit J Medicine & Med Res 2013; 3(4): 1222-1232.
Gallena SK, Tian W, Johnson AT, Vossoughi J, Sarles SA, Solomon NP. Validity of a new respiratory resistance measurement device to detect glottal-area change. J Voice 2013; 27(3): 299-304.
Haque T, Vossoughi J, Johnson AT, Bell-Ferrell W, Fitzgerald T, Scharf SM. Resistance measured by airflow perturbation compared with standard pulmonary function measures. Open J Respir Dis 2013; 3: 63-67.
Lausted CG, Johnston AT. Airflow perturbation device for measuring human respiratory resistance. Proceedings of the IEEE 1998; 97-99.
Lausted CG, Johnson AT. Respiratory resistance measured by an airflow perturbation device. Physiol Meas 1999; 20: 21-35.
Lemert J, Goldman MD, Johnson A, Vossoughi J, Silverman N, Saadeh CK. Portable handheld airflow perturbation device reflects forced oscillation resistance in children with asthma. Chest 2008; 130(4): 241S (Meeting Abstracts).
Lewis OD, Whitesell P, Whitesell J, Granger W, Vossoughi J, Johnson A. Changes in respiratory measurements with the airflow perturbation device and integrated pulmonary index in patients enrolled in cardiac and pulmonary rehabilitation. Chest 2016; 150(4) Supplement: p1123A
Lopresti ER, Johnson AT, Koh FC, Scott WH, Jamshidi S, Silverman NK. Testing limits to airflow perturbation device (APD) measurements. BioMed Eng Online 2008; 7: n28
Pan J, Saltos A, Smith S, Johnson A, Vossoughi J. Comparison of respiratory resistance measurements made with an airflow perturbation device with those made from impulse oscillomtry. J Med Eng 2013; Article Id 165782.
US Patent 4220161.
US Patent 6066101.
Vossoughi J, Johnson AT, Silverman NK. In-home hand-held device to measure respiratory resistance. Proceedings of the 1st Distributed Diagnosis and Home Healthcare Conference, 2006, 12-15.
Wong LS, Johnson AT. Decrease of resistance to air flow with nasal strips as measured by the airflow perturbation device. BioMed Eng Online 2004; 3: n38.