I was reading James Hansen’s textbook on pulmonary function testing (one of my more interesting reads lately) and in passing he mentioned using the VA/TLC ratio as a way to measure ventilation inhomogeneity. The VA/TLC ratio has also been called the Va,eff/VA ratio and the VA’/VA ratio by different researchers but regardless of what it is called it is the ratio between a single-breath TLC measurement (VA) taken from a DLCO test and a multi-breath (helium dilution or N2 washout) or plethysmographic TLC.
A single-breath TLC regardless of whether helium, nitrogen, methane or argon is used tends to underestimate TLC even in individuals with normal lungs (and if the ratio > 1.0 then there is likely a technical problem with either the lung volume or DLCO measurements). This is mostly because of the limited time a single breath of tracer gas has to mix and diffuse evenly throughout the lungs. The idea is that a low VA/TLC ratio indicates poor gas mixing and therefore an elevated ventilation inhomogeneity.
The VA/TLC ratio is a relatively simple approach towards measuring ventilation inhomogeneity largely because the results can be derived from regular TLC and DLCO measurements. It was first proposed as a measurement over 40 years ago but despite having several notable proponents it has not achieved any particular level of acceptance.
Part of the reason for this may be that there is limited agreement about what a constitutes a normal VA/TLC ratio. Cotes et al suggest that the ratio decreases slightly with age and stated that the normal range is 0.9 to 1.0 at age 20 and 0.85 to 0.95 at age 60. Roberts et al, however, in a study with a reasonably large population (n=379) selected for the presence or absence of certain conditions (normal, asthma, COPD) found no particular correlation with age (or height, weight and gender) and stated that in individuals with normal FEV1/FVC ratios the LLN was 0.828. Punjabi et al in a retrospective study of 5369 individuals unselected except for the presence of acceptable test quality stated that for FEV1/FVC ratios above 0.70 the VA/TLC ratio was 0.98.
There is general agreement however, that the strongest correlation between TLC and VA is an individual’s FEV1/FVC ratio.
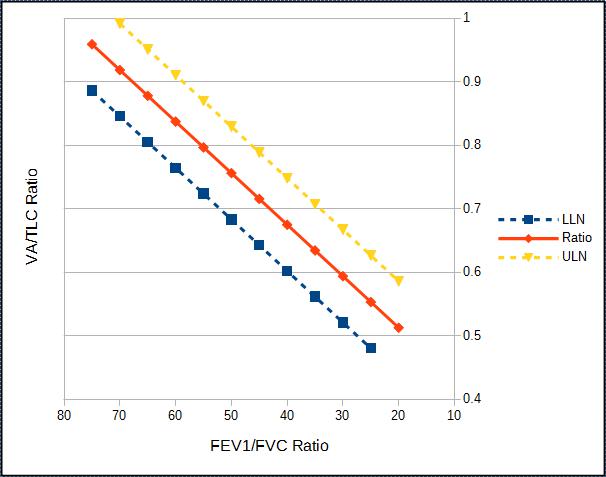
The correlation between VA/TLC ratio and the FEV1/FVC ratio from Burns et al.
![]()
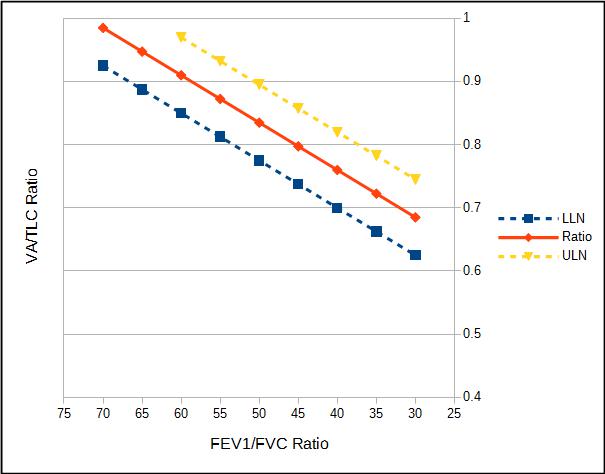
Correlation between the VA/TLC ratio and the FEV1/FVC ratio from Punjabi et al.
![]()
Ventilation inhomogeneity is a consequence of airway obstruction. As COPD progresses from mild to severe obstruction, FEV1 decreases and RV tends to increase. About 45 years ago Cotes proposed an Obstruction Index that combined the FEV1, RV and the VA/TLC ratio:
![]()
The normal range for the Obstruction Index is 20-40. With severe airway obstruction it increases to 80 and with pulmonary fibrosis it decreases to 10. Although this index never gained any acceptance it is still an interesting notion and it does combine many of the features that are still used to assess airway obstruction.
Roberts et al studied the repeatability of the VA/TLC measurement and showed the coefficient of variance to be 7.3%. The repeatability of lung volume measurements have been studied several times and the coefficient of variance for TLC measurements ranges from 2.2% to 4.25%. The repeatability of DLCO measurements has been studied several times but the repeatability of VA has unfortunately not been studied at the same time so its coefficient of variance is unknown. Although the coefficient of variance for the VA/TLC is larger than that for TLC, it probably what would be expected if VA had a coefficient of variance similar to TLC.
At the present time there are no standards for VA performance and quality. The DLCO (and VA) measurement requires an individual to exhale to RV and then inhale to TLC. The ATS/ERS statement for DLCO testing states that the inspired volume should be at least 85% of the FVC. This however, is based on research that has shown that DLCO measurements are relatively constant near TLC and it is unclear that this criterion is adequate for VA. Even if the inspired volume is 85% of the FVC, VA can be underestimated if the inspiration is not to TLC since the lung will not be fully expanded. VA may also be underestimated when the inspiration is to TLC if an individual does not full exhale to RV first because the inhaled gas mixture may not be evenly distributed during the inhalation.
The researchers that have studied VA/TLC have usually set reasonably high quality standards for their TLC and VA measurements and have been able to reject measurements that don’t meet quality criteria. Although PFT Lab are also interested in test quality when routine clinical lung volume and DLCO measurements are made, results are still have to be reported from patients that have difficulty meeting these same standards. For these reasons the clinical use of the VA/TLC ratio should probably be limited to those times when duplicate lung volume and DLCO measurements that meet the ATS/ERS standards for quality and repeatability have been performed.
Regardless of the quality and repeatability issues the biggest and perhaps most insurmountable problem with the VA/TLC ratio measurement is that VA is calculated from an alveolar sample that is optimized for DLCO measurement. For individuals with relatively normal lungs the inhaled gas mixture is homogeneously mixed and the measured VA is similar regardless which part of the alveolar sample is used to calculate it.
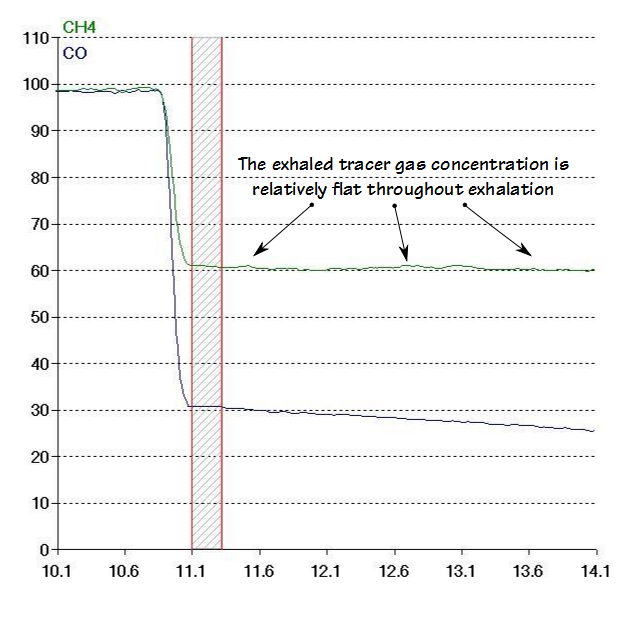
Exhaled DLCO gas waveforms from an individual with normal lungs.
But in individuals with severe airway obstruction, the inhaled gas mixture is inhomogeneously mixed and during exhalation the tracer gas concentration decreases throughout exhalation.
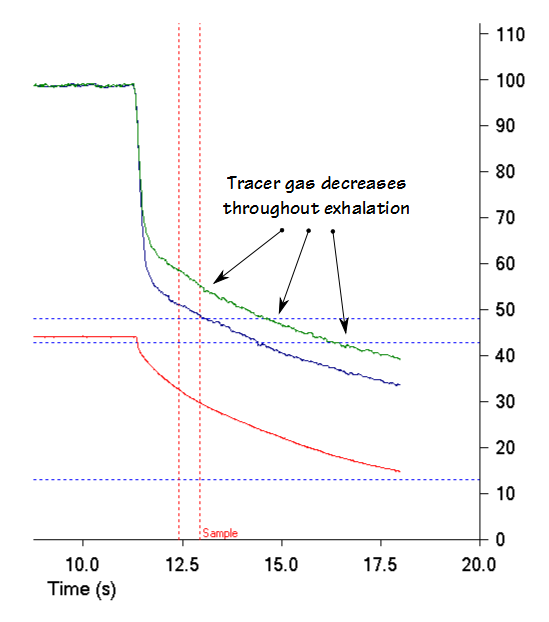
Exhaled DLCO gas waveforms from an individual with COPD
This means that the calculated VA depends greatly on the size of the exhaled sample and where exactly in the exhalation it is taken.
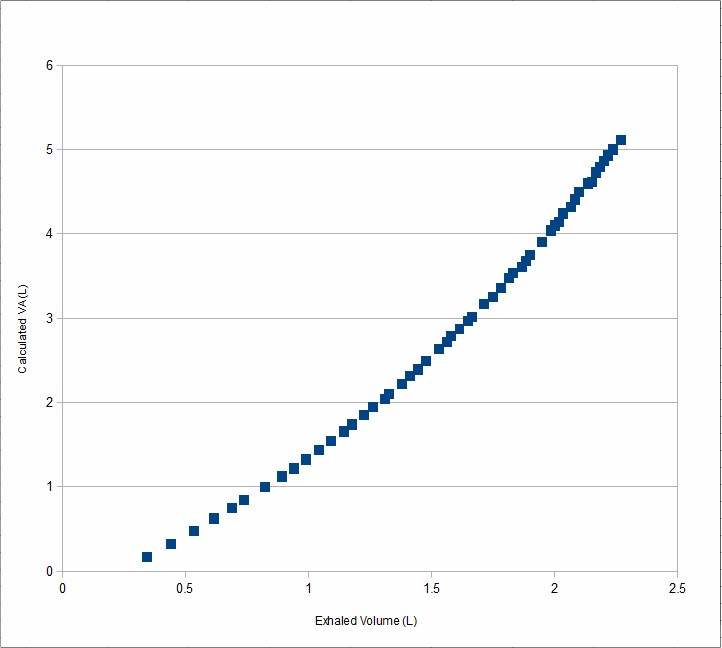
VA calculated from the changing tracer gas concentration.
Even if the washout and sample volume are rigorously controlled this aspect alone calls into question exactly what the VA/TLC ratio is measuring.
I’m interested in ventilation inhomogeneity since it is has the potential to be an important component in the assessment of airway obstruction. Clinicians have long noted that individuals with identical levels of airway obstruction often have very different levels of dyspnea and physical impairment. Similarly, individuals with COPD and asthma report changes in how well they feel that often occur without any apparent change FEV1 or Peak Flow. In both of these instances the changes and differences may be explained by other factors, one of which is the degree of ventilation inhomogeneity.
Even though it is an important aspect of lung disease, there is a lack of consensus in how ventilation inhomogeneity should be measured. Several tests have been used to measure ventilation inhomogeneity, notably the Lung Clearance Index (LCI), phase III of the single-breath N2 washout and the VA/TLC ratio. These tests have only rarely been compared to each other and for this reason their comparative sensitivity, accuracy and relevance is unclear.
Finally, the concept of ventilation inhomogeneity itself suffers from a lack of precision. FVC, FEV1, Peak Flow and other pulmonary function measurements have a basis in physical measurements such as volume and flow that permits them to be compared relatively precisely to normal values, to trended values and to other individuals. Although test for ventilation inhomogeneity have numerical results they can only be assessed qualitatively (good, fair, poor) and this is a significant limitation to its utility in both research and clinical care.
The VA/TLC ratio has the potential to provide information about gas mixing and ventilation inhomegeneities within an individual’s lung and I have occasionally used it as a teaching point when explaining pulmonary function tests to physicians and technicians. Its usefulness is severely limited however, partly because the level of accuracy of the VA/TLC ratio from routine lung volume and DLCO measurements is unclear, partly because the VA measurement is made using a washout and sample volume optimized for a different test and partly because results cannot be reported quantitatively. As interesting as it may be, I have trouble seeing how the VA/TLC ratio provides any clinically useful information to the assessment of an individual’s pulmonary function tests.
References:
Burns CB, Scheinhorn DJ. Evaluation of single-breath helium dilution total lung capacity in obstructive lung disease. Am Rev Resp Dis 1984; 130: 580-583.
Cotes JE. Lung volume indices of airway obstruction. A suggestion for a new combined index. Proc R Soc Med 1971; 64: 1232-1234
Cotes JE, Chinn DJ, Miller MR. Lung Function. Physiology, measurement and application in medicine. Sixth Edition, Blackwell Publishing, 2006.
Hankinson JL, Stocks J, Peslin R. Reproducibility of lung volume measurements. Eur Respir J 1998; 11: 787-790.
Hansen JE. Pulmonary function testing and interpretation. Jaypee Brothers Medical Publishers, 2011.
Loiseau A, Loiseau P, Saumon G. A simple method for correcting single-breath lung capacity for underestimation. Thorax 1990; 45: 873-877.
Loves RG, Attfield MD, Isles KD. Reproducibility of pulmonary function tests under laboratory and field conditions. Brit J Indust Med 1980; 37: 63-69.
Pesola GR, Magari RT, Dartey-Hayford S, Coelho-D’Costa V, Chinchilli VM. Total lung capacity: single breath methane dilution versus plethysmograph in normals. Respirology 2007; 12: 291-294.
Punjabi NM, Shade D, Wise RA. Correction of single-breath helium lung volumes in patients with airflow obstruction. Chest 1998; 114: 907-918.
Roberts CM, MacRae KD, Seed WA. Multi-breath and single breath helium dilution lung volumes as a test of airway obstruction. Eur Respir J 1990; 3: 515-520.
Rodarte JR, Hyatt RE, Westbrook PR. Determination of lung volume by single- and multiple-breath nitrogen washout. Am Rev Resp Dis 1976; 114: 131-136

PFT Blog by Richard Johnston is licensed under a Creative Commons Attribution-NonCommercial 4.0 International License
Thanks, Richard.
Is the VA/TLC ratio of lesser value in determining the level of gas trapping in the lungs, than an RV and RV/TLC ratio?
Is one set of the above values, address more specifically whether there is abnormal gas trapping present?
Or, in other words, say, collectively, even with a moderately elevated FRC, can normal values of VA/TLC, RV, RV/TLC and IC be used to rule-out abnormal gas trapping/hyperinflation levels?
Ed –
The VA/TLC ratio is probably going to be reduced when gas trapping or hyperinflation are present but it does not measure these factors directly. An elevated RV/TLC ratio (and in my opinion along with an elevated FRC) and a normal or elevated TLC is what should be used to determine gas trapping/hyperinflation. If FRC is elevated but the RV and RV/TLC ratio are normal would mean that gas trapping/hyperinflation is probably not present and is more likely due to other factors.
– Richard
Richard
VA/TLC seems to contain information not necessarily captured in FEV1/FVC. In over 500 patients with Alpha-1-antitrypsin deficiency we have found in multivariate analysis that VA/TLC was the best predictor of survival taking age into account, with sex, FEV1, FEV1/FVC, FVC, TLco and Kco not being significant. It was the best predictor in univariate analysis followed by TLco, FVC, FEV1 and then FEV1/FVC in that order (paper under review). I think it is worthy of application to COPD data sets to determine what is going to be the best way to score severity.
Martin
Martin –
I agree that VA/TLC is a way to measure ventilation inhomgeneity and that ventilation inhomogeneity is a missing (and likely critical) factor in assessing airway obstruction. I still have concerns about the reliability of VA/TLC measurement since it requires good quality lung volume and DLCO tests. VA/TLC is also somewhat sensitive to the washout and sample volume of the DLCO and this aspect has not been explored. The VA/TLC ratio, the lung clearance index (LCI) and the phase III of the single-breath N2 washout are all methods for measuring ventilation inhomegeneity but they have not been compared nor is it overly clear to me that they are measuring the same thing. I look forward to reading your paper and hope that it will throw some light on this subject.
– Richard