Hyperoxic CPETs

In patients with lung disease the use of supplemental oxygen during exercise increases oxygen consumption, endurance time and maximum workload, and decreases the sensation of dyspnea without increasing minute ventilation and maximum heart rate. My lab is occasionally asked to perform a CPET with an elevated FIO2 (hyperoxic CPET). We are capable of doing this but I’ve always had reservations, partly about the logistics involved in performing the CPET but more importantly with the interpretation of the results.

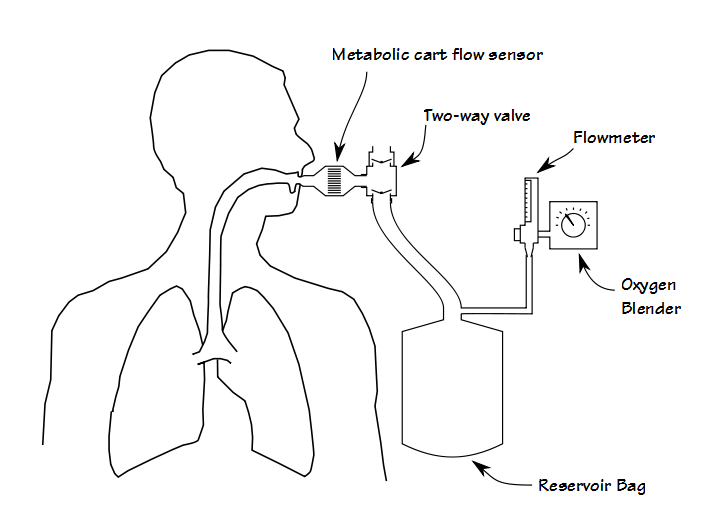
First, although it is certainly possible to perform some kinds of exercise test while the patient gets oxygen via a nasal cannula or mask, adding oxygen during a CPET requires that the patient breathes a hyperoxic gas mixture through their mouthpiece. Most commonly this is done by adding a two-way valve to the test system that is in turn attached to a reservoir bag which is filled from an oxygen blender.

CPET_Oxygen

Although functional, this adds extra dead-space and the valves add extra resistance, both of which increases the patient’s work of breathing. From a practical standpoint it also adds a fair amount of extra weight to the breathing manifold, often more than is comfortable for the patient. This means that some method for supporting the manifold must also put in place. About 25 years ago I performed CPETs using a treadmill that had a support arm and at that time the approach recommended by the equipment manufacturer was to suspend the breathing manifold using rubber tubing. This worked in that it supported the weight of the breathing manifold, but it didn’t do anything about its mass or inertia and when a patient transitioned from a walk to a jog, the mouthpiece manifold would bang against the patient’s teeth and mouth.

Continue reading

Treadmill protocols

Since I started performing exercise tests I’ve used both treadmills and bicycle ergometers. There are a several reasons that make ergometers somewhat better for exercise testing than treadmills. Most importantly the reduced noise and physical motion makes it easier to get blood pressure measurements and better quality ECG’s. In addition the workload can be set fairly precisely and they are safer for patients. Treadmills do have some advantages however, since patients are usually able to achieve a higher maximum oxygen consumption (~10%) and for many individuals walking is more natural than riding a bicycle.

When I’ve used a treadmill for exercise testing I’ve always used one version or another of the Bruce protocol. This choice was made by my medical directors but it has always seemed to get patients to their maximum exercise capacity within a reasonable period of time and it seemed to provide reasonable workloads for patients over a broad range of physical abilities. About a dozen years ago (the last time my PFT lab was moved) we no longer had room for a treadmill and replaced it with an ergometer. Since then, I haven’t thought much about treadmills and treadmill protocols.

Recently I was talking with a physician who is going to be performing exercise research with a treadmill. When he showed me the treadmill protocol he was planning on using I thought that the initial speed (3.3 MPH) was too high. Since his study population is going to consist of obese, deconditioned asthmatics, I suggested that for patient safety that it would be better to start at a lower speed and elevation. He asked if I could suggest a different treadmill protocol but I had to reply that all I had ever used was the Bruce protocol.

This brought up an interesting question however, and that is whether there is any such thing as an optimal treadmill protocol. To answer this question I undertook a broad survey of treadmill protocols and have to say that the answer is probably no. Strictly speaking, each treadmill protocol is intended for a specific range of physical effort and the selection of any one protocol has to be based on the expectations and limitations of a patient’s physical abilities.

Continue reading

How does a CPET show a Cardiac Limitation?

Recently a patient was referred to my lab for a CPET by his oncologist. The patient had been complaining of excessive shortness of breath particularly when climbing only a few stairs. The patient recently had a full PFT panel (spirometry, lung volumes, DLCO) and the results had showed mild restriction with a mild gas exchange defect. The patient’s shortness of breath symptoms were far more severe than could be explained by his PFTs however, so he had been referred to Cardiology and had an ECG stress test. The stress test results were normal so Cardiology told the oncologist that the patient’s problems were probably not cardiac.

Because the patient’s PFT results were reduced the patient’s oncologist consulted with a couple of our pulmonary physicians and they suggested a CPET. When I reviewed the patient’s CPET results despite a mildly reduced TLC and DLCO it was quite clear the patient’s primary limitation was in fact cardiac. Why was there such a discrepancy between Cardiology’s ECG stress test and our CPET? The simple answer is that a CPET measures oxygen consumption and a routine ECG stress test does not.

Strictly speaking, during a progressive exercise test any individual with normal heart and lungs usually reaches a cardiac limit before they reach any kind of a pulmonary limit and this is normal. A fit, athletic individual usually has a higher than normal stroke volume (and cardiac output) while a somebody that is out-of-shape has a reduced stroke volume (and cardiac output). This is one of the key differences between being conditioned and being de-conditioned.

So what are the hallmarks of an abnormal cardiac limitation?

There are, of course, many different types of cardiac disease but the common factor (at least in terms of a CPET) is an abnormal decrease in cardiac output. Cardiac output cannot be measured during exercise without specialized equipment or indwelling catheters but there is an intimate connection between cardiac output and VO2 as shown by the Fick equation:

Fick_Equation

Note: CaO2 and CvO2 refer to the oxygen content (in vol%) of arterial and venous blood respectively. I’ve frequently seen CaO2 and CvO2 described as the concentration of oxygen in the blood but although this may be semantically correct I feel it is imprecise because it is easily confused with the partial pressure of oxygen or oxygen saturation when it is actually a function of both of these properties:

O2_Content_Equation

Continue reading

Diagnosing Mitochondrial Myopathies

I’ve been reviewing my CPET textbooks trying to get a better idea of how to differentiate between different cardiovascular limitations. The other day I ran across an article on a related subject and thought it might be instructive.

The hallmark of cardiovascular limitations is the inability to deliver enough oxygenated blood to the exercising muscles. Another limitation that has similarities to this (and one that is infrequently diagnosed) is the inability of the exercising muscle to utilize the oxygen delivered to it. The best examples of this type of exercise limitation are mitochondrial myopathies (MM).

The mitochondria are the primary source of the ATP used by exercising muscle. There are several conditions that can cause the number of mitochondria to be reduced and there is wide variety of mitochondrial genetic defects. Mitochondria have their own genes and these can have both inherited or acquired genetic defects which can cause anything from mild to severe decreases in the ability to produce ATP. Mitochondria require oxygen to produce ATP so when the number of mitochondria are reduced or their ability to produce ATP is reduced the rate at which oxygen is consumed by an exercising muscle is also reduced.

A relatively common complaint of individuals with MM is dyspnea and exercise intolerance. One study found that 8.5% of all the patients referred to a dyspnea clinic had a mitochondrial myopathy of one kind or another. A definitive diagnosis requires a muscle biopsy but because the symptoms are often non-specific and a biopsy is an invasive procedure, it is usually not performed unless there more significant evidence suggesting a MM.

Continue reading

The effects of Obesity on lung function

Obesity has become far more commonplace than it was a generation ago. The reasons for this are unclear and have been attributed at one time or another to hormone-mimicking chemicals in our environment, altered gut biomes, sedentary lifestyles or the easy availability of high calorie foods. Whatever the cause, obesity affects lung function through a variety of mechanisms although not always in a predictable manner.

Spirometry:

Many investigators have shown a relatively linear relationship between an increase in BMI and decreases in FVC and FEV1. These decreases are small however, and FVC and FEV1 tend to remain within normal limits even in extreme obesity. The decreases in FEV1 and FVC tend to be symmetrical which is shown by the fact that the FEV1/FVC ratio is usually preserved in obese subjects without lung disease. Several studies have shown that the decreases in FVC and FEV1 are reversible since a decrease in weight showed a corresponding increase in FVC and FEV1.

In one study a 1 kg increase in weight correlated with a decrease in FEV1 of approximately 13 ml in males and 5 ml in females. The same increase in weight correlated with a decrease in FVC of approximately 21 ml in males and 6.5 ml in females. The greater change in FVC and FEV1 in males than females has been attributed to the fact that males tend to accumulate extra weight primarily in the abdomen.

The notion that abdominal weight has a disproportionate effect on lung function is seconded to some extent by studies that have shown that decreases in FVC and FEV1 correlated better with increases in waist circumference and the waist to hip ratio than with BMI. One study showed a 1 cm increase in waist circumference caused a 13 ml reduction in FVC and an 11 ml reduction in FEV1 across a range of elevated BMI’s.

Continue reading

The CPET’s not over until it’s over

My guidelines for interpreting CPETs originally started as notes to myself about what needed to be on the report and what the normal values were. They grew into a more formal set of instructions that were given to the pulmonary fellows when they were reviewing CPETs. Lately I’ve been reviewing them and re-reading the source material in order to make sure what I had written was still correct and so I could add references.

I tend to focus on one aspect of testing at a time and noticed while reviewing material that the measurements made at peak exercise or anaerobic threshold are almost always considered to be the most important test values. This is true to an extent, but information gathered both before and after testing is also important. In particular, after exercise has ended, during the recovery period, there are several measurements that should be made routinely and are diagnostically significant.

Heart rate recovery (HRR)

When exercise ends, an individual’s heart rate should start decreasing from its peak value. The heart rate recovery (HRR) is the difference between the heart rate at peak exercise and at some interval, usually 1 minute, post-exercise. The rise in heart rate during exercise is due to a combination of parasympathetic withdrawal and sympathetic activation. Vagal reactivation is the principle determinant of heart rate recovery after exercise and a reduction in the heart rate recovery (HRR) indicates a decrease in vagal tone specifically, and parasympathetic tone generally.

Continue reading

There’s more than one way to determine AT

As workload increases during a progressive cardiopulmonary exercise test (CPET) there comes a point at which the amount of oxygen delivered to the exercising muscle is no longer able to meet its needs. This is the point at which lactic acid begins to accumulate, CO2 production increases and is the accepted definition of the Anaerobic Threshold (AT). The “gold” standard for determining AT is lactic acid measurements but these require sampling blood at regular intervals throughout the CPET. AT is far more commonly determined from respiratory parameters.

Recently I had the opportunity to observe a CPET performed at another PFT Lab. Following the CPET I saw that there was some difficulty in determining the AT. Part of the reason for this is that the staff had only been shown the V-slope method and weren’t aware that there are several alternative approaches.

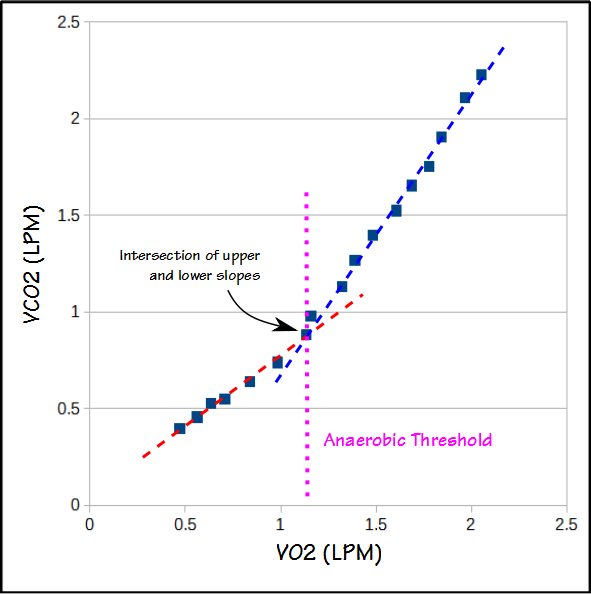
The V-slope method graphs VCO2 versus VO2. The slope of relationship between VCO2 and VO2 both above and below AT is relatively linear, but changes at AT.

V-slope

Continue reading

What’s a normal post-pneumonectomy CPET?

Recently a CPET report for an individual whose primary complaint was tachycardia and DOE with minimal activity came across my desk. Since the patient had had an pneumonectomy (one lung removed) about a year ago there wasn’t much doubt the results would be reduced, the question was whether they were reduced more than they should have been.

You might expect lung function to decrease by half following a pneumonectomy but because the remaining lung always expands to some extent FVC and TLC tend to be approximately 60%-65% of their pre-surgical volume. Although this increase in volume however does not increase the alveolar-capillary surface area the entire cardiac output needs to pass through the remaining lung which causes an increase in the pulmonary capillary blood volume. For this reason DLCO also tends to be about 65% of baseline.

Observed: %Predicted:
FVC (L): 2.08 62%
FEV1 (L): 1.62 57%
FEV1/FVC (%): 79 92%
TLC (L): 2.89 64%
DLCO (ml/min/mmHg): 11.55 54%

With the exception of the DLCO the patient’s pulmonary function results were about what would be expected following a pneumonectomy. It’s hard to be sure the DLCO is anomalously low because the surgery was performed at a different hospital and we don’t have any pre-surgical pulmonary function results to compare them to. Since this is also the first time the patient had a CPET there isn’t anything to compare the current results to either.

Continue reading

What does it mean when Ve exceeds its predicted during a CPET?

When I review the results from a CPET I am used to considering a maximum minute ventilation (Ve) greater than 85% of predicted as an indication of a pulmonary mechanical limitation. Recently a CPET report came across my desk with a maximum minute ventilation that was 142% of predicted. How is this possible and does it indicate a pulmonary mechanical limitation or not?

It is unusual to see a Ve that is greater than 100% of predicted. We derive our predicted max Ve from baseline spirometry and calculate it using FEV1 x 40. We have tried performing pre-exercise MVV tests in the past and using the maximum observed MVV as the predicted maximum Ve but our experience with this has been poor. Patients often have difficulty performing the MVV test correctly and realistically even if it is performed well the breathing maneuver used during an MVV test is not the same as what occurs during exercise. Since both Wasserman and the ATS/ACCP statement on cardiopulmonary exercise testing recommend the use of FEV1 x 35 or FEV1 x 40 as the predicted maximum minute ventilation we no longer use the MVV.

There are usually only two situations where a patient’s exercise Ve is greater than their predicted max Ve. First, when a patient is severely obstructed their FEV1 is quite low and FEV1 x 40 may underestimate what they are capable of since they are occasionally able to reach a Ve a couple of liters per minute higher than we expected. Second, if the FEV1 is underestimated due to poor test quality then the predicted max Ve will also be underestimated. In this case however, the baseline spirometry had good quality, was repeatable and the results did not show severe obstruction but instead looked more like mild restriction.

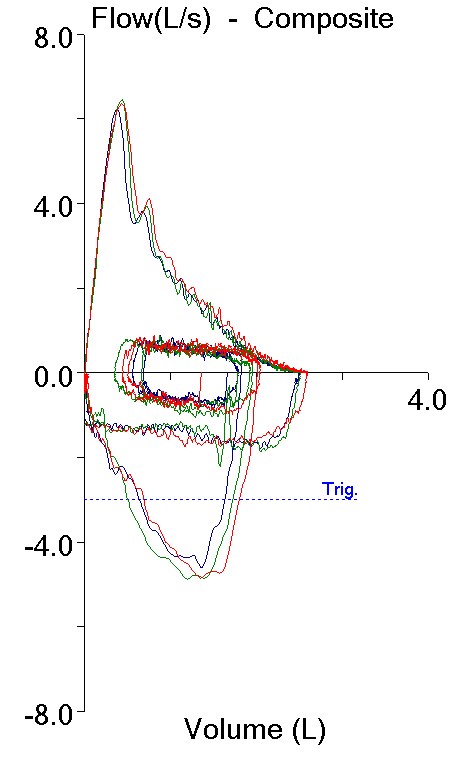
Pre_Exercise_FVLs

Effort 1: Effort 2: Effort 3:
FVC (L): 2.51 2.52 2.60
FEV1 (L): 1.86 1.87 1.95
FEV1/FVC %: 74 74 75
PEF: 6.26 6.46 6.37

Continue reading

Is it Dynamic Hyperinflation or something else?

Patients with COPD often have a ventilatory limitation as their primary limitation to exercise. A ventilatory limitation to exercise has traditionally been assessed by the breathing index or the breathing reserve:

breathing index = Peak Ve / Predicted MVV

breathing reserve = 1 – (Peak Ve / Predicted MVV)

which are basically two different ways of saying the same thing. In either case a breathing index greater than 85% or breathing reserve less than 15% is an indication that a patient has reached a ventilatory limit to exercise. There is some disagreement as to whether the predicted MVV should come from a MBC test performed by the patient or from the patient’s FEV1 x 40. I have tried both approaches and my experience has been that FEV1 x 40 is the best indicator for a patient’s predicted MVV. This is also Wasserman’s (my go-to source for exercise testing) recommendation so this is what we use.

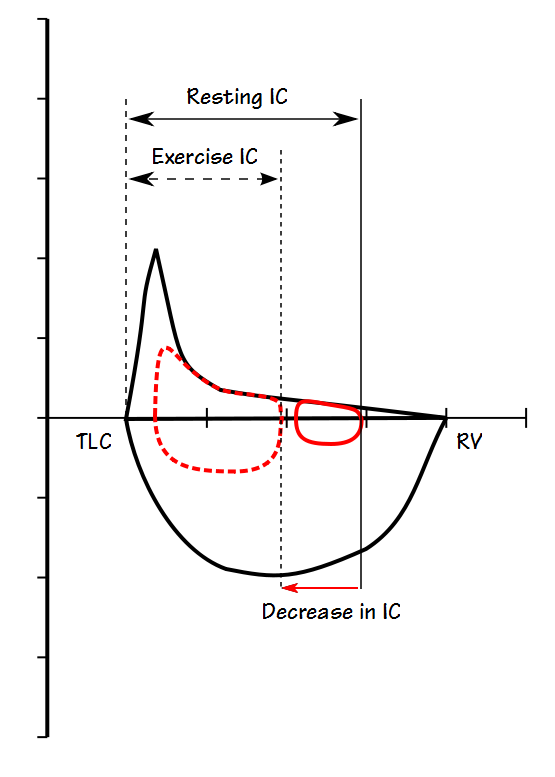
Individuals with COPD are occasionally hyperinflated at rest (i.e. elevated FRC and RV) and more commonly they dynamically hyperinflate during exercise. Research has shown that those individuals with are flow-limited during tidal breathing at rest almost always hyperinflate with exercise. Patients who are not flow-limited at rest but still have a low FEV1 and FEV1/FVC ratio may also hyperinflate. Because hyperinflation limits a patient’s tidal volume response to exercise it may cause an individual to have a limitation to exercise that occurs at a minute volume below the 85% threshold.

Exercise IC

Continue reading