Recently a CPET report for an individual whose primary complaint was tachycardia and DOE with minimal activity came across my desk. Since the patient had had an pneumonectomy (one lung removed) about a year ago there wasn’t much doubt the results would be reduced, the question was whether they were reduced more than they should have been.
You might expect lung function to decrease by half following a pneumonectomy but because the remaining lung always expands to some extent FVC and TLC tend to be approximately 60%-65% of their pre-surgical volume. Although this increase in volume however does not increase the alveolar-capillary surface area the entire cardiac output needs to pass through the remaining lung which causes an increase in the pulmonary capillary blood volume. For this reason DLCO also tends to be about 65% of baseline.
| Observed: | %Predicted: | |
| FVC (L): | 2.08 | 62% |
| FEV1 (L): | 1.62 | 57% |
| FEV1/FVC (%): | 79 | 92% |
| TLC (L): | 2.89 | 64% |
| DLCO (ml/min/mmHg): | 11.55 | 54% |
With the exception of the DLCO the patient’s pulmonary function results were about what would be expected following a pneumonectomy. It’s hard to be sure the DLCO is anomalously low because the surgery was performed at a different hospital and we don’t have any pre-surgical pulmonary function results to compare them to. Since this is also the first time the patient had a CPET there isn’t anything to compare the current results to either.
| Max: | %Predicted: | |
| VO2 (LPM): | 0.95 | 54% |
| VO2 (ml/kg/min): | 18.2 | 54% |
| VCO2 (LPM): | 1.05 | |
| RER: | 1.11 | |
| Ve (LPM): | 31.3 | 48% |
| Vt (L): | 1.12 | |
| RR: | 28 | |
| HR (BPM): | 165 | 86% |
| O2 Pulse (ml/beat): | 5.8 | 63% |
In addition, the patient stopped exercising because of dizziness, not because of shortness of breath or leg fatigue, so it wasn’t really as maximal a test as it could have been. Given that the RER was 1.11 and the maximum heart rate was 86% of predicted it was at least an adequate test but it’s somewhat doubtful that the maximum VO2 from the CPET was truly the maximum VO2 the patient was capable of.
Taking the CPET results at face value it was interesting to see that the patient did not show any pulmonary limitations to speak of. The maximum minute ventilation was less than half of predicted and there had been only minor increases in tidal volume and respiratory rate so the patient wasn’t even close to a pulmonary mechanical limitation.
In terms of gas exchange there was no desaturation (SpO2 at peak exercise was 97%), the Ve-VCO2 slope was 22.1 and the Ve/VCO2 at AT was 32, both of which are well within normal limits. Other than the DLCO being a bit lower than might be expected there was no indication of pulmonary vascular disease.
What the results do indicate was that the primary limitation is probably cardiovascular. The chronotropic index (the slope of heart rate versus VO2) was elevated at 1.51 (normal range is 0.8 to 1.3) and the maximum O2 pulse was reduced at 63% of predicted. If I had not known about the pneumonectomy I would have said there there was a cardiovascular limitation secondary to a reduced stroke volume but the real question is whether this is a normal post-pneumonectomy pattern or not.
It’s been quite a while since I last saw a CPET performed on somebody with a pneumonectomy so I spent some time researching the subject. I was disappointed to find that for the first time in a long time Wasserman failed me. Wasserman has always been my go-to source for CPET interpretation and I wasn’t able to find a single thing about assessing post-pneumonectomy CPETs in his textbook. When I searched the literature I was able to find hundreds of articles on the use of PFTs and CPETs in pre-operative assessment but only a handful of articles that had actual pre- and post-surgical comparisons.
The consensus, such as it is, it that the post-pneumonectomy VO2 and Ve do not decrease quite as much as FVC or DLCO and that this decrease tends to range between 20% and 30%. It has also been noted that both cardiac output and stroke volume decrease following a pneumonectomy. This is due to an increase in pulmonary vascular resistance which in turn is due to the increased blood flow through the remaining vasculature. Not surprisingly the decreases in cardiac output and stroke volume are proportional to the decrease in VO2 (or should that be vice-versa?).
These facts makes the patient’s max VO2 of 54% and max O2 pulse of 63% of predicted look excessively low. Mitigating that to some extent is the fact that we don’t know what the patient’s pre-surgical PFT or CPET results were. There is also the fact that the max VO2 (and O2 pulse) is likely a bit less than the patient is actually capable of.
Even so the maximum VO2 as probably lower than it should be. There are three primary factors that can limit VO2. Pulmonary mechanical (the ability to get air in and out of the lung), pulmonary vascular (the ability to exchange oxygen and carbon dioxide) and cardiovascular (the ability to pump blood around the body):
- There is no apparent pulmonary mechanical limitation. Despite the decrease in TLC and VC caused by the pneumonectomy the maximum minute ventilation was still well below the predicted maximum.
- There is no apparent pulmonary vascular limitation. SpO2 and the Ve-VCO2 slope were quite normal. Because pulmonary arterial pressure usually rises following a pneumonectomy you might expect a pattern similar to pulmonary hypertension but other than the DLCO that may be reduced more than it should there was no evidence for that.
- There does appear to be a cardiovascular limitation. This is shown by the reduced maximum O2 pulse and elevated chronotropic index. These appear to be reduced out of proportion to what would be expected from a pneumonectomy.
The evidence therefore continues to be in favor of a cardiovascular limitation.
Over the last year or so our ECG system and metabolic cart finally failed, although at different times. Not surprising since they were about 14 years old. Neither was supported by their manufacturer any more and neither could be repaired. We were able to get them replaced but one unfortunate side effect was that the procurement process for each system was different and we ended up with an ECG system and metabolic cart that couldn’t be interfaced with each other.
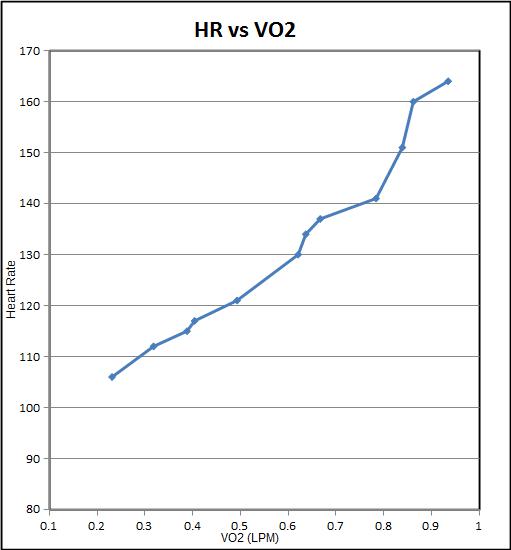
We still get good information from each system but one graph we no longer routinely get is heart rate versus VO2. Since the patient had complained of tachycardia at low levels of exercise I thought it would be worthwhile to take a closer look at the relationship between heart rate and VO2. I manually entered the 30-second interval data from both systems into a spread sheet and when I graphed the data I found that the HR-VO2 slope seemed to increase at a HR of around 140.
For the same reasons O2 pulse also needs to be manually calculated. When I did this, I found that the patient’s O2 pulse plateaued at about the same time.
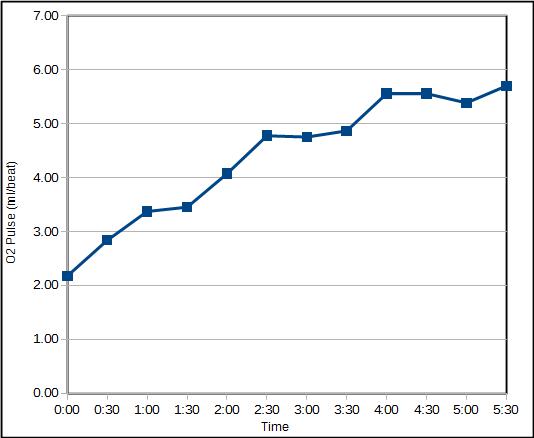
Normal, both heart rate and stoke volume increase throughout exercise. In this case however, it appears that the patient’s stroke volume plateaued around a heart rate of 140. This means that above a heart rate of 140 the only way that cardiac output and VO2 could increase was by increasing heart rate. Although a decrease in stroke volume is one consequence of a pneumonectomy, plateaus in O2 pulse have not been reported. This may be a limitation of the studies however, since I’ve found that only the peak exercise values were reported and you need the interval data to see a plateau.
In the past we’ve see this change in HR-VO2 slope only once or twice a year. When I’ve been able to follow up with this the most frequent cause appears to have been valve disease although the literature on this says that ischemia is also a possible cause. This patient will likely be sent for a more complete cardiac workup.
This problem points out a limitation in the chronotropic index calculations since they are performed with only the resting and maximum heart rate and VO2. This patient’s chronotropic index was elevated, which by itself indicates a reduced stroke volume, but that single number does not indicate there was a change in the HR-VO2 slope mid-exercise which has a quite different interpretation. Even though this is a relatively infrequent problem I will take this as a stern reminder to myself that if you don’t look for it, you won’t find it. In the future we will plot this data for every CPET we perform.
It is obvious that a pneumonectomy will reduce pulmonary function and exercise capacity but these decreases are not necessarily as great as might be expected at first glance. The ability to accurately assess post-pneumonectomy PFT and CPET results however, requires knowledge of their pre-surgical values. Although the lack of this information hampered our ability to interpret the results in this case there appears to be an abnormal stroke volume limitation and not as might be expected, a pulmonary mechanical or pulmonary vascular limitation.
References:
Bolliger CT, Jordan P, Soler M, Stulz P, Tamm M, Wyser Ch, Gonon M, Perruchoud AP. Pulmonary function and exercise capacity after lung resection. Eur Respir J 1996; 9: 415-421.
Brunelli A, Refai M, Salati M, Xiume F, Sabbatini A. Predicted versus observed FEV1 and DLCO after major lung resection: A prospective evaluation at different postoperative periods. Ann Thorac Surg 2007; 83: 1134-1139.
Hsia CC, Carlin JI, Cassidy SS, Ramanathan M, Johnson RL. Hemodynamic changes after pneumonectomy in the exercising foxhound. J Appl Physiol 1990; 69(1): 51-57.
Hsia CCW, Ramanathan M, Estrera AS. Recruitment of diffusing capacity with exercise in patients after pneumonectomy. Amer Rev Resp Dis 1992; 145(4): 811-816.
Nezu K, Kushibe K, Tojo T, Takahama M, Kitamura S. Recovery and limitation of exercise capacity after lung resection for lung cancer. Chest 1998; 113: 1511-1516.
Nugent AM, Carragher AM, McManus K, McGuigan JA, Gibbon JRP, Riley MS, Nicholls DP. Effect of thoracotomy and lung resection on exercise capacity in patients with lung cancer. Thorax 1999; 54: 334-338.
Pelletier C, Lapointe L, LeBlanc P. Effects of lung resection on pulmonary function and exercise capacity. Thorax 1990; 45: 497-502
Wasserman K, Hansen JE, Sue DY, Stringer WW, Whipp BJ. Principles of exercise testing and interpretation, Fourth Edition, Published by Lippincott, Williams and Wilkins, 2005.

PFT Blog by Richard Johnston is licensed under a Creative Commons Attribution-NonCommercial 4.0 International License