Two PFT reports came across my desk recently and comparing them got me to thinking about Peak Expiratory Flow (PEF). The FEV1 from both tests were mildly reduced with an FEV1/FVC ratio that was moderately reduced and an FVC that was within normal limits.

| Observed: | %Predicted: | |
| FVC (L): | 3.72 | 96% |
| FEV1 (L) | 2.17 | 78% |
| FEV1/FVC (%): | 58 | 80% |
| PEF (L/sec): | 2.97 | 41% |

| Observed: | %Predicted: | |
| FVC (L): | 2.46 | 88% |
| FEV1 (L) | 1.66 | 75% |
| FEV1/FVC (%): | 67 | 83% |
| PEF (L/sec): | 7.65 | 128% |
Both tests also showed mild airway obstruction but despite this the Peak Flows were quite different. One test had a PEF that was moderately to severely reduced and the other had a PEF that was elevated. It’s fascinating that two such completely different flow-volume loops are so numerically similar.
In another sense, though, how can these two different spirometry efforts both be labeled as mild airway obstruction? Or more importantly, they both may be mild obstruction but isn’t the quality of the obstruction different?
Unfortunately for this thought PEF is not part of any spirometry interpretation algorithm I am familiar with. The only research I was able to find linking PEF to a particular form of airway obstruction was performed over 40 years ago. It suggested that the FEV1/PEF ratio (ml/LPM) could be used as a way to assess the presence of upper airway obstruction. This research was performed at a time when flow-volume loops were less commonly available and ratios in the FEV1/PEF above 8 were suggested as way to flag patients for further workup. Flow-volumes are now routine, so the value of this ratio, particularly since poor test effort can also produce elevated FEV1/PEF ratios, looks to be limited and in any case this ratio is not routinely reported by any spirometry test system anyway.
Even though PEF is not used as part of any differential diagnoses it has found many other purposes.
PEF has been routinely used to monitor asthmatics and to detect occupational asthma for decades but this is primarily through comparing trends. Even so it’s unclear to me how good a reduced or elevated PEF by itself is in detecting or ruling out airway obstruction. There are numerous studies that come down on both sides of this but I think that part of the problem is that many of the studies have used Peak Flow meters, not the PEF obtained from a spirometry effort. Peak flow meters have limited accuracy and depending on how they are constructed they may be more or less sensitive to different aspects of Peak Flow itself.
Note: There are relatively easy ways to “fool” a peak flow meter depending on how an individual performs the peak flow maneuver. I have personally known some asthmatics who have deliberately raised their results in order to avoid being put on prednisone and some who have lowered their results in order to show how bad off they “really” were. Moreover, peak flow meters are often handed to patients without any training and even when they were trying their best, their peak flow maneuvers (at best learned from the product inserts) were often not correct.
Peak flow can be characterized by two values, Rise Time (RT) and Dwell Time (DT). These values are derived from a graph of flow-versus time. Rise Time is the length of time from the start of exhalation to 90% of the PEF. Dwell Time is how long expiratory flow stays above 90% (or 95%) of the PEF.
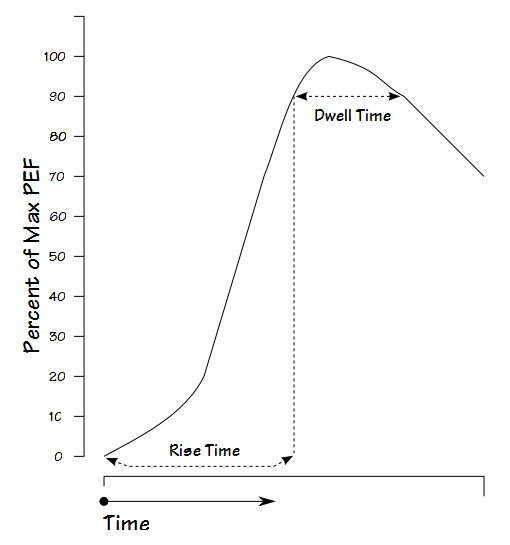
One study showed RT to vary from 23 to 168 milliseconds and DT to vary from 5 to 164 milliseconds in a large study group. Interestingly, both RT and DT tended to be shorter for individuals with airflow obstruction than those with normal lungs. This is likely a reflection of the lower peak flow these individuals usually attain as well as the inability to sustain high flow rates. The mechanical characteristics of any given Peak Flow meter likely affects how accurately they are able to register changes in peak flow for different patients which has implications for both individual use and group comparisons made with Peak Flow meters.
Spirometers are usually tested against the standard ATS flow-volume loop waveforms. The original 26 waveforms however, have RT’s from 50 to 184 milliseconds and DT’s from 34 to 254 milliseconds. Although most flow-based systems would meet the range of Rise and Dwell times mentioned above (it’s how they were measured after all), it does mean that the ATS waveforms may need to be updated.
Several studies have indicated PEF can be useful in assessing spirometry test quality but the guidelines for this aren’t as clear as I’d like. In particular the ATS/ERS statement on spirometry indicates that the “largest FVC and the largest FEV1 … should be recorded after examining the data from all of the usable curves, even if they do not come from the same curve” and does not mention Peak Flow at all. I think the disconnect lies in the difference in the definitions for “best quality FEV1” and “largest FEV1”.
A forced vital capacity maneuver is supposed to be performed with maximal effort. A maximal expiratory effort will compress airways and narrow them, which increases the resistance to air flow. A submaximal effort will not compress airways as much and can produce higher expiratory flow rates for longer periods of time. For these reasons maximal efforts tend to have the highest PEF but can also have a lower FEV1 than a submaximal effort. Strictly speaking therefore, the selection an FEV1 should use the best PEF as one of the guidelines. In my PFT Lab the largest FEV1 doesn’t have to come from the effort with the highest PEF but it should come from an effort where the PEF is within about 5% of the best PEF. This means that we occasionally report an FEV1 that is not the largest a patient produced, but it is also reasonable assurance that the FEV1 came from an effort with maximal effort.
Having said that the ATS/ERS spirometry statement doesn’t say that PEF should be used to assess test quality, it does indicate that it should be used to assess the repeatability of spirometry efforts. Specifically, the two highest PEFs from a series of spirometry efforts should be within 0.67 L/sec (40 LPM) of each other. This means that when this criteria is met a reported FEV1 will likely come from an effort with a reasonably good PEF. In my PFT Lab we still have to manually “eyeball” the results however, to assure repeatability because our test system’s software does not provide an assessment of PEF repeatability in the same way it does for FVC and FEV1 by visually flagging the results.
Numerous investigators have shown that PEF can increase following an inhaled bronchodilators . Despite this the ATS/ERS statement on interpretation does not discuss PEF and limits the assessment of bronchodilator response to just FVC and FEV1. One reason for this is may be that PEF is more effort dependent than FEV1 and post-BD changes aren’t as reliable an indicator of bronchodilation. Another may be that clinically significant bronchodilation that is reflected by changes in FVC and FEV1 may not be reflected by equally significant changes in PEF. Since there is still widespread debate about what a significant response to bronchodilator actually is and since there can be clinically significant post-BD changes in FRC, IC, PIF and FIV1 without significant change in FVC and FEV1 I’d say the door is still open on this issue.
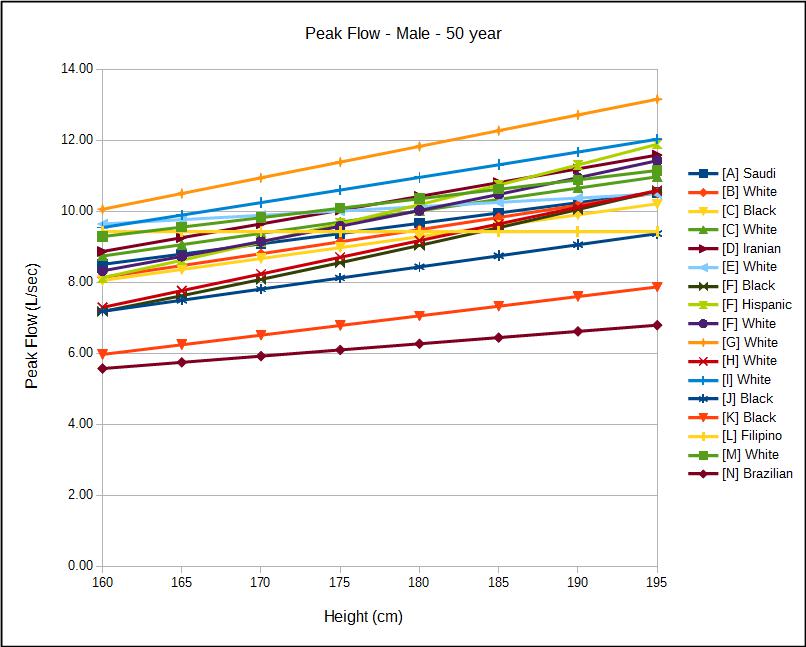
As with all other PFT values, there is always the question about what’s normal. I have been able to find 17 usable reference equations for males and 13 usable reference equations for females (some published equations produced results that did not match that of the study despite careful proofreading). More so than any of the other PFT values like FVC, FEV1, TLC and DLCO, there is a much wider range of “normal” PEF. For a 175 cm male, the range from the highest and lowest predicted PEF was approximately 7 L/sec. This was relatively independent of age and is a minimum of 50% of the maximum predicted PEF. For a 165 cm female the absolute difference for between the highest and lowest predicted was smaller, about 3 L/sec, but this is also relatively independent of age and also about 50% of the maximum predicted PEF.
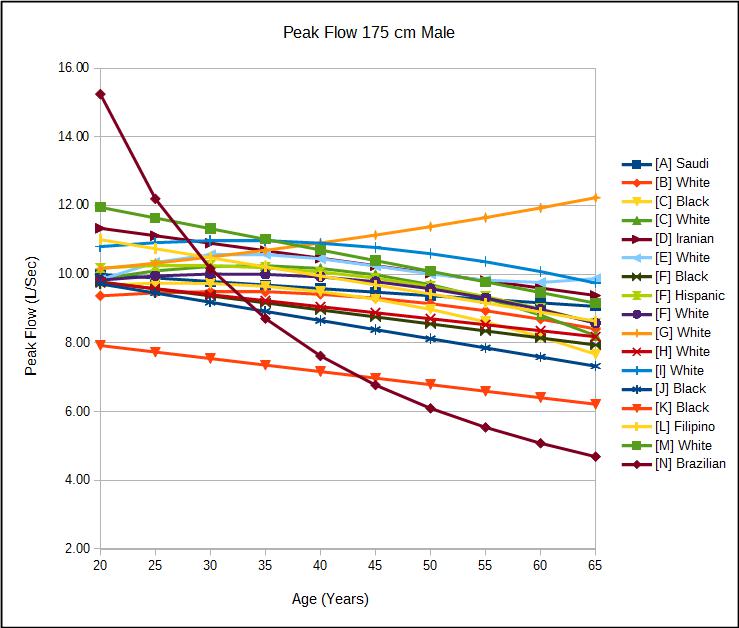
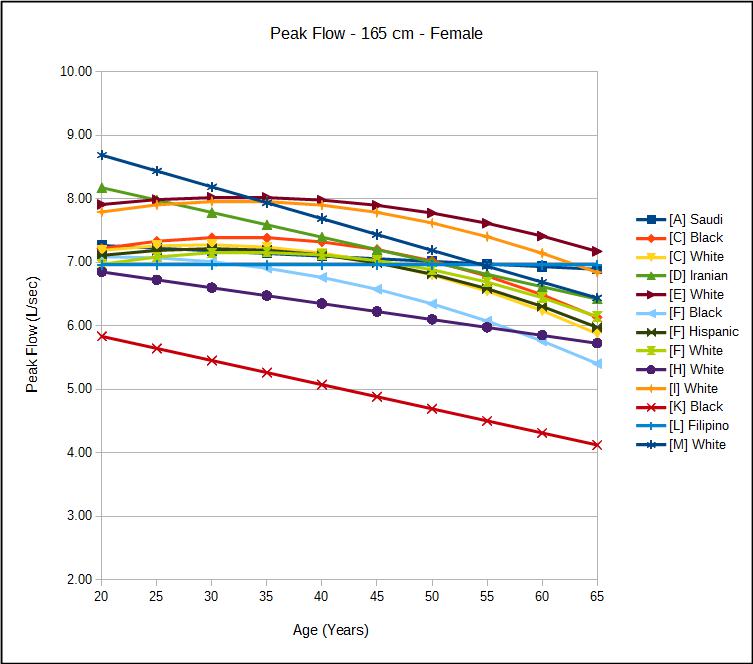
Interestingly height appears to have less of an effect on any predicted PEF than it does for FVC, FEV1, TLC and DLCO.
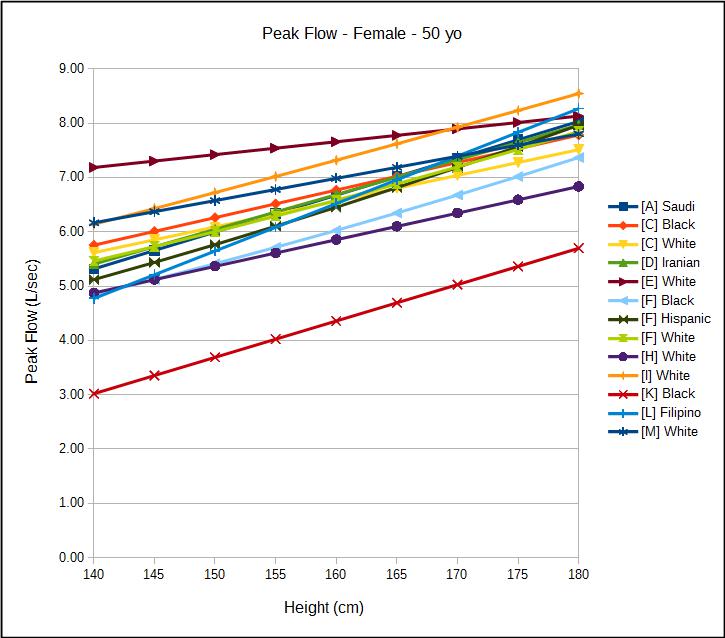
There also appears to be ethnicity based differences in PEF that are similar to those in FEV1. I have been unable to find any systematic comparison of PEF and ethnicity however, and these studies date over a 40 year period. PEF is likely more sensitive to the technology used to measure it than is FEV1 (specifically, PEF is likely underestimated in volume-displacement spirometers) and I would hesitate to draw any conclusions before this aspect is taken into consideration.
I still feel that PEF is saying something when it comes to differentiating between different forms of airway obstruction. That shouldn’t be surprising since it’s well known that the flow-volume loop has distinct contours for different lung diseases and PEF is a significant aspect of these contours. PEF is dependent on maximal patient effort however, and that limits its ability to be a reliable indicator. The exceptionally wide range of normal values also makes it difficult for an initial and isolated measurement of PEF to be used to assess airway obstruction. Despite its limited ability to assess lung function PEF can and should routinely be used to assess the quality and repeatability of spirometry results.
Male Peak Flow Reference Equations
| Reference: | Equation: |
| [A] Saudi | (17.274-(1.243 x age)+(3.471 x height))/60 |
| [B] White | EXP(-4.548+(1.2965 x LN(height))+(0.0066 x age)-(0.000106 x age^2)) |
| [C] Black | -2.041+(0.07552 x age)-(0.001414 x age^2)+(0.0616 x height) |
| [C] White | -3.244+(0.13976 x age)-(0.002077 x age^2)+(0.0637 x height) |
| [D] Iranian | (0.07759 x height) – (0.0435 x age) – 13.69 |
| [E] White | (-30.15 + (30.63 x age) – (0.723 x age ^2) + (0.00521 x age^3) + (height x 1.46))/60 |
| [F] Black | 2.2257-(0.04082 x age)+(0.00027333 x height^2) |
| [F] Hispanic | 0.087+(0.0658 x age)-(0.001195 x age^2)+(0.00030243 x height^2) |
| [F] White | 1.0523+(0.08272 x age)-(0.001301 x age^2)+(0.00024962 x height^2) |
| [G] White | (0.000342 x age^2)+(0.0169 x age)+(0.0885 x height)-5.8 |
| [H] White | (0.094 x height)-(0.035 x age)-5.993 |
| [I] White | EXP(-3.76+(1.17 x LN(height))+(0.00706 x age)-(0.00011 x age^2)) |
| [J] Black | -0.1545-(0.0532 x age)+(0.0625 x height) |
| [K] Black | -0.814-(0.038 x age)+(5.429 x (height/100)) |
| [L] Filipino | 6.872+(0.0692 x weight)-(0.0527 x age) |
| [M] White | (5.317 x (height/100))-(0.062 x age)+3.884 |
| [N] Brazilian | 2.7183^(LN(height x 0.83)-LN(age x 0.114)-1.43) |
Female Peak Flow Reference Equations:
| Reference: | Equation: |
| [A] Saudi | ((4.076 x height)-(0.499 x age)-226.648)/60 |
| [C] Black | -2.185+(0.07535 x age)-(0.00117 x age^2)+(0.0507 x height) |
| [C] White | -1.457+(0.06296 x age)-(0.001084 x age^2)+(0.0474 x height) |
| [D] Iranian | (0.06402 x heightp)-(0.039 x age)-1.607 |
| [E] White | (198.07+(3.07 x age)-(0.0477 x age^2)+(1.42 x heightp))/60 |
| [F] Black | -1.3597+(0.03458 x age)-(0.000847 x age^2)+(0.00019746 x height^2) |
| [F] Hispanic | 0.2401+(0.06174 x age)-(0.001023 x age^2)+(0.00022203 x height^2) |
| [F] White | 0.9267+(0.06929 x age)-(0.001031 x age^2)+(0.00018623 x height^2) |
| [H] White | (0.049 x height)-(0.025 x age)-0.735 |
| [I] White | EXP(-4.794+(1.316 x LN(heightp))+(0.00926 x age)-(0.000143 x age^2)) |
| [K] Black | -4.453-(0.038 x age)+(6.695 x (height/100)) |
| [L] Filipino | -7.463+(0.0874 x height) |
| [M] White | (4.087 x (height/100))-(0.05 x age)+2.945 |
Reference Equation Study Characteristics:
| Reference: | Ethnicity: | #Female: | Female Ages: | #Male: | Male Ages: |
| [A] | Saudi | 292 | 18-65 | 175 | 18-65 |
| [B] | White | 4908 | 25-60 | 4743 | 18-60 |
| [C] | White | 1224 | 18-65 | 2844 | 18-65 |
| [C] | Black | 383 | 18-65 | 591 | 18-65 |
| [D] | Iranian | 1110 | 21-80 | 1302 | 21-80 |
| [E] | White | 199 | 14-64 | 202 | 14-64 |
| [F] | White | 927 | 21-80 | 476 | 21-80 |
| [F] | Black | 772 | 21-80 | 422 | 21-80 |
| [F] | Hispanic | 872 | 21-80 | 506 | 21-80 |
| [G] | White | 270 | 20-70 | ||
| [H] | White | 321 | 20-79 | 128 | 25-79 |
| [I] | White | 7009 | 18-80 | 4565 | 18-80 |
| [J] | Black | 117 | 18-47 | 143 | 18-47 |
| [K] | Black | 205 | 18-90 | 206 | 18-85 |
| [L] | Filipino | 153 | 16-68 | 130 | 17-78 |
| [M] | White | 96 | 18 to >70 | 83 | 18 to >70 |
| [N] | Brazilian | 270 | 25-75 | 373 | 20-75 |
References:
[A] Al Ghobain MO, Ahamad EH, Alorainy HS, Hazmi MA, Al Moamary MS, Al-Hajjaj MS, Idress M, Al-Jahdali H, Zeitouni M. Spirometric reference standards for healthy nonsmoking Saudi adults. Clinical Respir J 2014; 8: 72-78.
[B] Brandli O, Schindler Ch, Kunzli N, Keller, R, Perruchoud AP. Lung function in healthy never smoking adults: reference values and lower limits of normal of a Swiss population. Thorax 1996; 51: 277-283
Brusasco V, Crapo R, Viegi G. ATS/ERS Task Force: Standardisation of Lung Function Testing. Standardisation of Spirometry. Eur Respir J 2005; 26: 319-338.
Empey DW. Assessment of upper airways obstruction. Brit Med J 1972; 3: 503-505.
[C] Glindemeyer HW, Lefante JJ, McColloster C, Jones RN, Weill H. Blue-collar normative spirometric values for caucasian and African-American men and women aged 18 to 65. Am J Respir Crit Care Med 1995; 151: 412-422.
[D] Golshan M, Nematbakhsh M, Amra B, Crapo RO. Spirometric reference values for a large Middle Eastern population. Eur Respir J 2003; 22: 529-534.
[E] Gregg I, Nunn AJ. Peak Flow in normal subjects. Brit Med J 1973; 3: 282-284
[F] Hankinson JL, Odencrantz JR, Fedan, KB. Spirometric reference values from a sample of the general U.S. Population. Amer J Resp Crit Care 1999; 159: 179-187
[G] Hedenstrom H, Malmberg P, Fridriksson HV. Reference values for lung function tests in men: Regression equations with smoking variables. Upsala J Med Sci 1986; 91: 299-310
Hegewald MJ, Lefor MJ, Jensen RL, Crapo RO, Kritchevsky SB, Haggerty CL, Bauer DC, Satterfield S, Harris T. Peak expiratory flow is not a quality indicator for spirometry. Peak expiratory flow variability and FEV1 are poorly correlated in an elderly population. Chest 2007; 131: 1494-1499.
Krowka MJ, Enright PL, Rodarte JR, Hyatt RE. Effect of effort on measurement of Forced Expiratory Volume in one second. Am Rev Resp Dis 1987; 136: 829-833.
[H] Knudsen RJ, Slatin RC, Lebowitz MD, Burrows B. The maximal expiratory flow-volume curve. Normal standards, variability and effects of age. Am Rev Resp Dis 1976; 113: 587-601.
[H] Kuster SP, Kuster D, Schindler C, Rochat MK, Braun J, Held L, Brandli O. Reference equations for lung function screening of healthy never-smoking adults aged 18-80 years. Eur Respir J 2008; 31: 860-868.
[I] Mengesha YA, Mekonnen Y. Spirometric lung function tests in normal non-smoking Ethiopian men and women. Thorax 1985; 465-468.
Miller MR, Pedersen OF, Quanjer PH. The rise time and dwell time for peak expiratory flow in patients with and without airflow limitation. Am J Resp Crit Care Med 1998; 158: 23-27.
[J] Perfura-Yone EW, Kanko-Nguekam NF, Kengne AP, Balkissou AD, Noseda A, Kuaban C. Spirometric Reference Equations for semi-urban and urban Bantu Cameroonians. Open J Resp Dis 2013; 3: 164-174.
[K] Roa CC, Zaldivar CA, Salonga RC, Bobadilla J, Lansang MA, Reodica R, Balgos A, Blanco J, Tanchuco JQ. Normal standards for ventilatory function in adult Filipinos. Phillipine J Internal Med, 2013; 51(1): 1-6.
[L] Roberts CM, MacRae KD, Winning AJ, Adams L, Seed WA. Reference values and prediction equations for normal lung function in a non-smoking white urban population. Thorax 1991; 46: 643-650.
[M] Pereira CADC, Sato T, Rodrigues SC. New Reference Values for forced spirometry in white adults in Brazil. J Bras Pneumol 2007; 33: 397-406.
Thiaden HA, De Bock GH, Van Houwelingen JC, Dekker FW, De Waal MWM, Springer MP, Postma DS. Can peak expiratory flow measurements reliably identify the presence of airway obstruction and bronchodilator response as assessed by FEV1 in primary care patients presenting with a persistent cough. Thorax 1999; 54: 1055-1060.

PFT Blog by Richard Johnston is licensed under a Creative Commons Attribution-NonCommercial 4.0 International License
As a medical sales rep for Morgan Scientific, Inc. and Vitalograph it’s been my experience that poor peak flows in spirometry are primarily due to poor coaching. The FEV1.0’s may or may not be consistent with a good effort as I can mimic a poor peak flow and a good peak flow and have virtually the same FEV1.0’s within 5%.
Interesting. Then, could an unusually maximal FVC effort, that presumably would include great effort inhaling as well as great effort exhaling in a spirometry test, actually serve to drive-down the FEV1/FVC ratio of the patient’s test results?
In other words, a patient who really put an extraordinary effort into inhaling (which would increase the FVC value results), and then exhaled with that same “high-effort” (which would produce increased resistance on the airway passages) would reduce their FEV1 value due to narrower than “normal” (“normal” meaning what would occur for patients who merely used an adequate effort) airway passages.
Is there a point where “trying too hard” during the FVC phase of a spirometry test, result in somewhat lower test values (especially the FEV1/FVC ratio)?
Ed –
An extraordinary inspiratory effort is not going to get you a larger FVC since the FVC volume is determined by anatomy (the rib cage and diaphragm can only expand by a fixed amount). Next, you can’t say that the FEV1 that comes from a test with low effort is the “normal” FEV1 simply because it is larger. A Forced Vital Capacity is supposed to be performed with maximal effort, not one that’s “adequate”. That’s sort of the point of the test. Only by stressing the airways can you see if they are functioning properly.
– Richard
Terrific blog Richard! Are their spirometry results that would influence a treatment decision if PEF and clinical presentation were good? In other words, does the adage about ‘treating the patient not the test’ also apply to spirometry? Thanks. Paul
One of the physicians I work with said that when a patient’s PFT results are below normal doctors have to resist the temptation to keep adding medications in order to bring the patient up to “normal” and that they have to try to realize when the patient is as good as they are going to get. My own personal take is that whether or not specific PFT results are normal or below normal can help you diagnose a patient’s condition but it is the trend in PFT results that is more important for managing treatment.