There’s more than one way to determine AT

As workload increases during a progressive cardiopulmonary exercise test (CPET) there comes a point at which the amount of oxygen delivered to the exercising muscle is no longer able to meet its needs. This is the point at which lactic acid begins to accumulate, CO2 production increases and is the accepted definition of the Anaerobic Threshold (AT). The “gold” standard for determining AT is lactic acid measurements but these require sampling blood at regular intervals throughout the CPET. AT is far more commonly determined from respiratory parameters.

Recently I had the opportunity to observe a CPET performed at another PFT Lab. Following the CPET I saw that there was some difficulty in determining the AT. Part of the reason for this is that the staff had only been shown the V-slope method and weren’t aware that there are several alternative approaches.

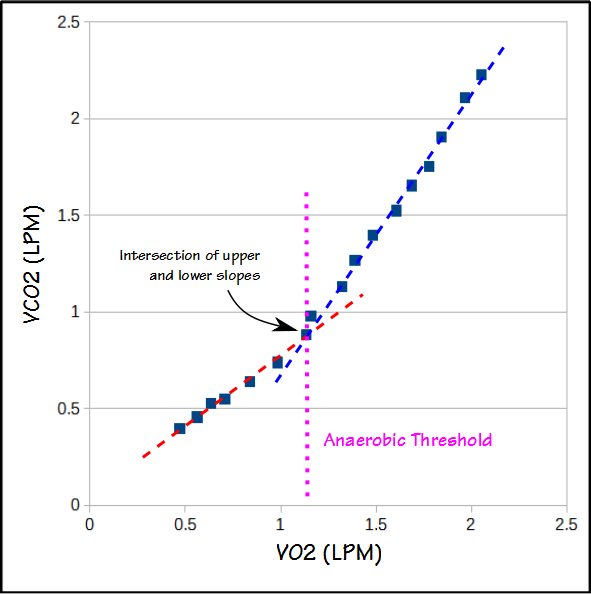
The V-slope method graphs VCO2 versus VO2. The slope of relationship between VCO2 and VO2 both above and below AT is relatively linear, but changes at AT.

V-slope

Continue reading

Ve-VCO2 slope: Just to AT or all the way to the peak?

We’ve had some questions lately about some of our CPET guidelines. These questions were informational in nature not confrontational but they served to remind us that the reference values we use for CPET interpretation were developed and put in place at least ten years ago and it is past time they were reviewed. As a starting point I’ve been re-reading the ATS-ACCP and AHA statements on cardiopulmonary exercise testing. One sentence from the AHA statement concerning the Ve-VCO2 slope caught my eye. Specifically:

“… calculation of the Ve/VCO2 slope with all exercise data obtained from a progressive exercise test (initiation to peak effort) appears to provide additional clinical information compared with submaximal calculations (i.e. those that use linear data points before the steepening associated with ventilatory compensation for metabolic acidosis).”

Ve-VCO2 slope is calculated using a linear regression function and we have been calculating it using only the test data between the start of exercise and the anaerobic threshold. The AHA statement however says we should be calculating it using the data all the way up to peak exercise (the ATS/ACCP statement is mute on this point since it does not even discuss Ve-VCO2 slope other than as a graph). Because Ve-VCO2 slope is a key component in our assessment of CPET results it is important that we get this right.

Ve and VCO2 have a reasonably linear relationship up to the anaerobic threshold. After the anaerobic threshold ventilation is driven by acidosis as well as CO2. This means that the Ve-VCO2 slope tends to be steeper (greater change in Ve per unit of VCO2) after anaerobic threshold than it was before. A Ve-VCO2 slope calculated from the entire CPET will therefore have steeper slope than one calculated using just using rest to AT.

VeVCO2 Slopes


Continue reading