When a Pulmonary Mechanical Limitation to exercise isn’t the real limitation

Recently I was reviewing a cardio-pulmonary exercise test (CPET) that at first glance seemed to show the patient had a pulmonary mechanical limitation. Specifically, the patient’s minute ventilation (Ve) at peak exercise was 93% of predicted. This was something you’d expect if a patient had an obstructive or restrictive lung disease but I could see right away that the patient’s baseline pulmonary function tests were actually pretty normal.

Baseline PFTs

The maximum oxygen consumption was 73% of predicted so it was apparent the patient had an exercise limitation of some kind but based on a number of other factors I didn’t think it had anything to do with the mechanical aspects of the patient’s lung.

CPET Summary

Continue reading

Ve-VCO2 slope: Just to AT or all the way to the peak?

We’ve had some questions lately about some of our CPET guidelines. These questions were informational in nature not confrontational but they served to remind us that the reference values we use for CPET interpretation were developed and put in place at least ten years ago and it is past time they were reviewed. As a starting point I’ve been re-reading the ATS-ACCP and AHA statements on cardiopulmonary exercise testing. One sentence from the AHA statement concerning the Ve-VCO2 slope caught my eye. Specifically:

“… calculation of the Ve/VCO2 slope with all exercise data obtained from a progressive exercise test (initiation to peak effort) appears to provide additional clinical information compared with submaximal calculations (i.e. those that use linear data points before the steepening associated with ventilatory compensation for metabolic acidosis).”

Ve-VCO2 slope is calculated using a linear regression function and we have been calculating it using only the test data between the start of exercise and the anaerobic threshold. The AHA statement however says we should be calculating it using the data all the way up to peak exercise (the ATS/ACCP statement is mute on this point since it does not even discuss Ve-VCO2 slope other than as a graph). Because Ve-VCO2 slope is a key component in our assessment of CPET results it is important that we get this right.

Ve and VCO2 have a reasonably linear relationship up to the anaerobic threshold. After the anaerobic threshold ventilation is driven by acidosis as well as CO2. This means that the Ve-VCO2 slope tends to be steeper (greater change in Ve per unit of VCO2) after anaerobic threshold than it was before. A Ve-VCO2 slope calculated from the entire CPET will therefore have steeper slope than one calculated using just using rest to AT.

VeVCO2 Slopes


Continue reading

Exercise Oscillatory Ventilation

Recently I was trying to make some sense of an exercise test report that had come across my desk. Numerical results on our CPET reports are averaged over 30 second periods and there seemed to be a lot of variability from one time interval to the next. This isn’t uncommon in the first couple of minutes of an exercise test because patients often start off too hard and too fast, overshoot and then take a while to settle down into a steady pattern. This variability however, persisted throughout the entire test. I finally realized that what I was seeing was Exercise Oscillatory Ventilation (EOV).

It has been a while since I last saw a patient with EOV. Part of the reason for this is that EOV is a sign of relatively advanced heart failure and most of the patients who have cardiac disease have already had standard ECG stress testing and tend not to get referred for a cardiopulmonary exercise test (CPET). Having said that, it is a bit surprising that we don’t see this more often since there tends to be an association between pulmonary disease and cardiac disease and we do exercise tests relatively frequently on patients with combined lung and heart disease in order to determine their primary cause for shortness of breath. Nevertheless, even though one study estimated that up to 30% of patients with heart failure exhibit EOV (although most studies estimate it somewhere between 7% and 12%), it is not something we have ever seen with any frequency.

Ve_vs_time_3

Continue reading

DLO2/Qc, SaO2 and CPETs

There are a number of simple observations that can be made during a cardio-pulmonary exercise test (CPET) that can point you immediately in a specific diagnostic direction. Recently I was reminded of this while reviewing the CPET results on patient with a complicated medical history whose test had been requested as part of a pre-operative assessment.

Most patients that are candidates for cardio-thoracic surgery do not need to have a CPET and that’s because it is usually straightforward to determine who is high risk and who is low risk from other routine tests. When risk is hard to determine or equivocal, the cardio-thoracic surgeons will order a CPET. They are primarily interested in the VO2 max and Ve-VCO2 slope since there are a number of widely accepted pre-op assessment algorithms that use these values. Even if the CPET results indicate the patient is high risk, the test details can help determine whether there is anything that can be done to improve the patient’s odds.

The patient whose report I was reviewing had moderately severe airway obstruction (FEV1 57% of predicted), mild restriction (TLC 77% of predicted) and a moderate gas exchange defect (DLCO 51% of predicted). This would normally pre-dispose me to look for a pulmonary vascular or pulmonary mechanical exercise limitation but there was a single test value that told me the limitation was going to be cardiovascular instead. That test value was the SaO2 at peak exercise which was 99%.

Continue reading

Vd/Vt, how accurate is it really?

My lab stopped inserting A-lines to get arterial blood samples during exercise testing well over 10 years ago. Our decision was partly based on the fact that we didn’t do them often enough to be good at it and partly based on the fact that we didn’t think that we were getting enough extra information from ABG’s to be worth the effort. Since another local hospital (a competitor but part of the same medical school network so we share pulmonary fellows with them) routinely performs level II and level III exercise tests we felt we could refer any patients that really needed ABG’s to the lab there. We don’t regret the decision and don’t feel that it has compromised the quality of our exercise testing.

Because we don’t obtain ABG’s, one of the values we don’t calculate is the deadspace/tidal volume ratio (Vd/Vt). Recently I was reading an article that related Ve-VCO2 to Vd/Vt and I was reminded of some the issues I had with Vd/Vt when I calculated it in the past. We’ve gone through two different exercise test systems since that time so I’m not sure if some of these problems still exist but I thought it would be a good idea to review both the problems and the literature on Vd/Vt to see if I could make some sense of them.

As a reminder, the original Bohr equation for Vd/Vt was:

Original Bohr Equation

The first problem I had run into was that mixed-expired CO2 (PECO2) is routinely calculated from CPET data as:

PECO2 Equation

But it was also reported as a separate value by the test system’s software and the two values did not match.

Continue reading

OUES, a useful sub-maximal CPET indicator of maximum VO2

The primary goal of a Cardio-Pulmonary Exercise Test (CPET) is to determine an individual’s maximum oxygen consumption (VO2), minute ventilation (Ve) and heart rate (HR). An adequate CPET is usually indicated by a Respiratory Quotient (VCO2/VO2) that is greater than 1.10, a heart rate greater than 85% of predicted or a Ve greater than 85% of predicted. There are a variety of reasons why patients are unable to exercise to their maximum. Although these reasons can of course include poor motivation, factors such a musculo-skeletal limitations or concerns about patient safety due to EKG changes can cause patients have a sub-maximal test.

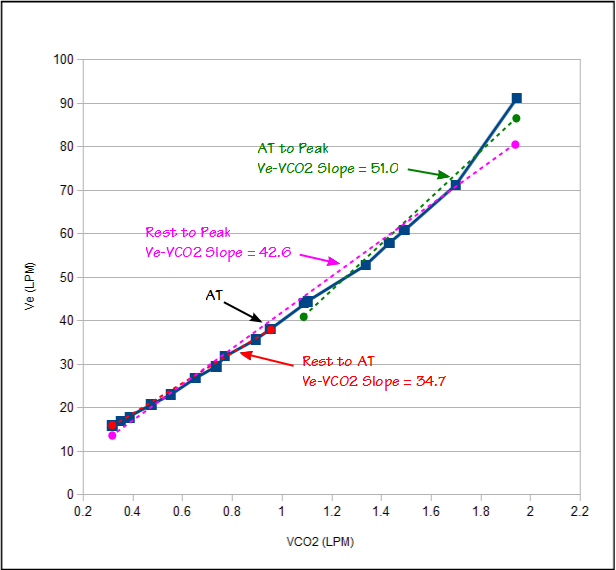
Assessing a sub-maximal test is problematic but there are a number of derived CPET values that have been shown to be useful indicators even when the amount of test data is limited. We have used the Ve-VCO2 slope as one of these indicators for quite a while. Ve-VCO2 slope can be calculated using the Ve and VCO2 from the entire CPET or from just the pre-anaerobic threshold data. Given that there is usually a different Ve-VCO2 slope after AT that is influenced by lactic acidosis as well as VCO2 compared to the slope before AT our preference has been to use only pre-AT data. This means that a CPET can be significantly sub-maximal and we can still get an accurate Ve-VCO2 slope.

The Ve-VCO2 slope is primarily sensitive to the match between ventilation and perfusion in the lung. There is a loose correlation between the Ve-VCO2 slope and cardiac disease and this is usually because of the pulmonary consequences of cardiac disease, not because it is necessarily sensitive to cardiac output or peripheral vascular disease.

An individual’s maximum VO2 is a significant indicator of morbidity and mortality from cardiac disease but when a CPET is sub-maximal the VO2 will be as well. The Ve-VCO2 slope does not correlate well with maximum VO2 and cannot be used as a way to estimate it. A number of investigators however, have shown that the Oxygen Uptake Efficiency Slope (OUES) strongly correlates with maximum VO2 and that OUES can be calculated from sub-maximal CPET test data.

Continue reading

CO2 response testing, still crazy after all these years.

I’ve had several exercise tests come across my desk lately where the patient had an elevated Ve-VCO2 slope. An elevated Ve-VCO2 slope during exercise is usually taken as a sign of pulmonary vascular disease however these patients had a normal DLCO so I have been reviewing the literature to try to get a better understanding of what the Ve-VCO2 slope is trying to tell us in these cases.

Although the majority of the literature on Ve-VCO2 response indicates that it is likely due to some form of pulmonary vascular disease (micro-fracturing of the pulmonary capillaries, increased pulmonary vascular resistance, V-Q mismatching) there are some investigators that feel that in some individuals it is more likely due to an increased ventilatory chemosensitivity to CO2. It has been over 25 years since I last performed a CO2 response test and at that time there was no particular consensus on how the test should be performed. Since chemosensitivity may have a distinct bearing on Ve-VCO2 slope I thought it would be a good idea to also review the literature on CO2 response and see what has happened in the meantime.

After spending some time reading a couple dozen research papers it doesn’t seem as if much has changed. The CO2 Response landscape remains without an overall consensus and if anything has become more confusing, not less. There are two major approaches to measuring CO2 response and each of these approaches has at least two ways of analyzing the test data.

Continue reading

PETCO2 during exercise, a quick diagnostic indicator

I was reviewing a cardiopulmonary exercise test (CPET) recently. The test was part of a pre-op workup for a patient with lung cancer who also had a diagnosis of COPD. I had looked at the spirometry results first (we always do spirometry pre- and post-exercise) and seeing that the patient had severe airway obstruction (FEV1 < 50% of predicted) assumed the review would be relatively straightforward. I then saw just one exercise test value and knew immediately that this wasn’t going to be an ordinary test. That test value was the PETCO2 at anaerobic threshold, which happened to be 40.

There are a number of CO2-related values that are useful when assessing exercise test results. Although End-tidal CO2 (ETCO2) is not a quantitative measurement in the same sense that minute ventilation or oxygen consumption is, it is still able to provide a lot of useful information about ventilatory efficiency and disease states.

Continue reading

Chronotropic Index and O2 Pulse

One of the things that I enjoy most about reviewing cardiopulmonary exercise tests is that I always have to reach back into the basics of physiology in order to get a sense of what the results are trying to say. Oftentimes it isn’t so much the absolute or percent predicted value of a given parameter but its relationship with other parameters that is revealing. One of the bits of human physiology that has always struck me as fascinating is the relationship between heart rate and oxygen consumption.

For almost everyone there is a linear relationship between heart rate and oxygen consumption. When you plot them against each other you can put a ruler on the plotted points and see that they form a straight line. Chronotropic Index and O2 pulse are two ways of analyzing this relationship.

Continue reading

Peak VO2 and low body weight

The PFT Lab I am associated with performs cardiopulmonary exercise tests for pre-op cardiothoracic surgery patients with lung cancer. Surgeons have to make a decision to operate or not based at least in part on the amount of function they think will remain after a lung resection and this depends on which and how many lobes are involved. This calculation is done by taking a percentage based on the amount of lung tissue that will be lost which is weighted using ventilation-perfusion scan results off the baseline DLCO and vital capacity. When the result is inconclusive or there are other medical factors that can affect a patient’s prognosis the results from a CPET can help with the surgeon’s decision.

The criteria that has been most often cited as an indicator of acceptable surgical risk is a peak VO2 greater than 15 ml/kg/min. About ten years ago we encountered a patient with a significantly low body weight. His max VO2 was about 16 ml/kg/min which appeared to make him a good candidate for surgery but his actual maximum oxygen consumption in LPM was 45% of predicted. This discrepancy was due to the fact that his BMI was about 14. We re-calculated what his peak VO2 would have been if his body weight had been normal and that was less than 10 ml/kg/min. For this reason our recommendation at that time was that the patient was a poor candidate for surgery. Continue reading