Recently I was trying to make some sense of an exercise test report that had come across my desk. Numerical results on our CPET reports are averaged over 30 second periods and there seemed to be a lot of variability from one time interval to the next. This isn’t uncommon in the first couple of minutes of an exercise test because patients often start off too hard and too fast, overshoot and then take a while to settle down into a steady pattern. This variability however, persisted throughout the entire test. I finally realized that what I was seeing was Exercise Oscillatory Ventilation (EOV).
It has been a while since I last saw a patient with EOV. Part of the reason for this is that EOV is a sign of relatively advanced heart failure and most of the patients who have cardiac disease have already had standard ECG stress testing and tend not to get referred for a cardiopulmonary exercise test (CPET). Having said that, it is a bit surprising that we don’t see this more often since there tends to be an association between pulmonary disease and cardiac disease and we do exercise tests relatively frequently on patients with combined lung and heart disease in order to determine their primary cause for shortness of breath. Nevertheless, even though one study estimated that up to 30% of patients with heart failure exhibit EOV (although most studies estimate it somewhere between 7% and 12%), it is not something we have ever seen with any frequency.
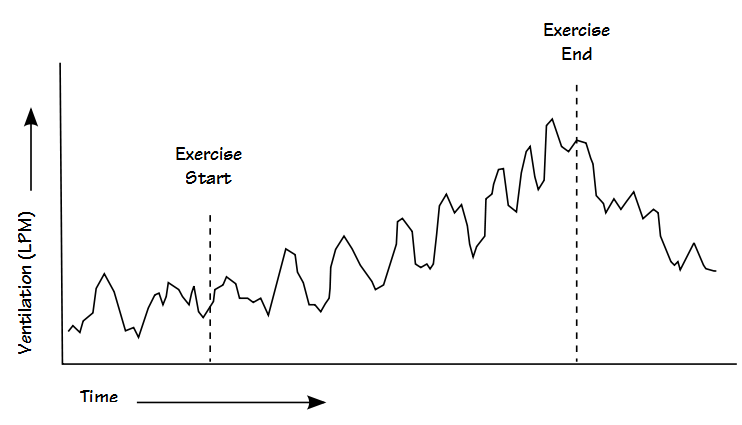
EOV is a condition where minute ventilation (Ve) rises and falls (oscillates), usually with a period between 30 to 60 seconds. EOV can persist throughout exercise or fall off at the higher exercise levels. Several researchers have indicated that it is often present at rest as well as during exercise but this not something I’ve seen in the few patients we’ve had with EOV. Interestingly, the oscillation in Ve comes primarily from a cyclic pattern in tidal volume.
EOV was first noticed only as a change in ventilation but it has since been realized that oxygen consumption (VO2) and CO2 production (VCO2), as well as PETO2 and PETCO2 rise and fall along with ventilation. At least one study has indicated there is reason to believe that pulmonary blood flow oscillates in these patients as well. Even though Ve, VO2 and VCO2 rise and fall together, the ventilatory equivalents, Ve/VCO2 and Ve/VO2, also tend to show an oscillatory pattern although this usually less pronounced than those of Ve, VO2 or VCO2. Because heart rate does not show this oscillatory pattern this means that O2 pulse oscillates as well.
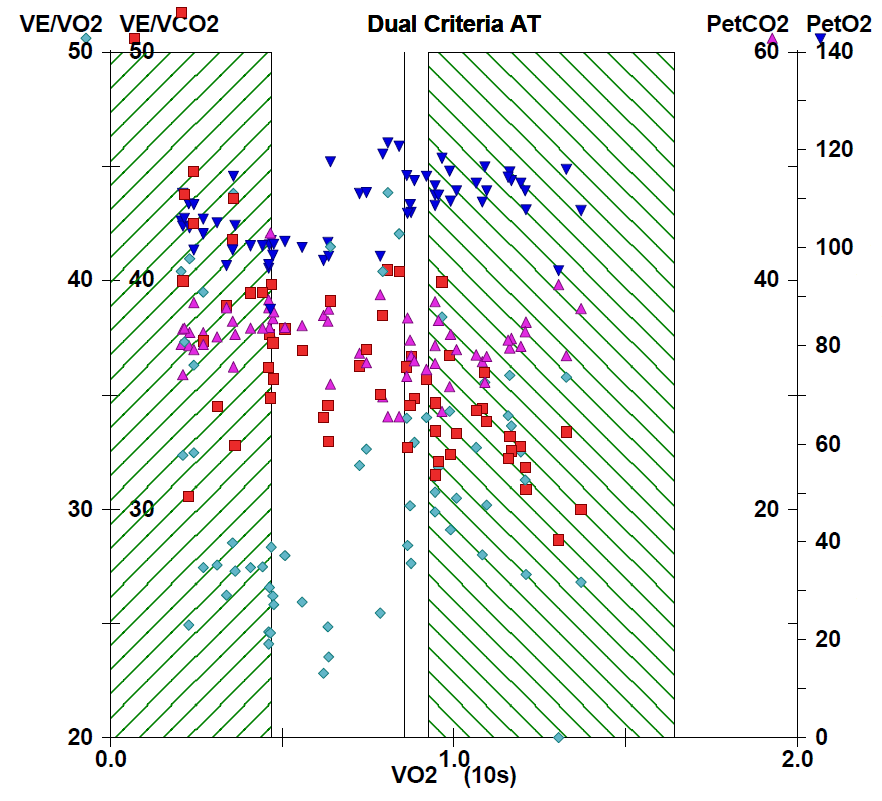
One reason that EOV may not be recognized more frequently is that it tends to be obvious only when Ve (or VO2) is plotted against time. This graph is not considered part of the standard panel of exercise test graphs however, and this is because it usually isn’t particularly informative when assessing CPET results except perhaps as an overview. Our CPET system routinely plots Ve/VCO2 and Ve/VO2 versus time in order to help with the determination of the anaerobic threshold, but this is done on a breath by breath basis and is usually quite “noisy”. It’s difficult enough to determine the nadirs of Ve/VCO2 and Ve/VO2 let alone see any oscillation.
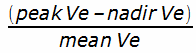
When properly graphed EOV is usually easy to recognize but like many other observations it lacks an official definition. One fairly concise definition used by researchers is a greater than 25% variation in the amplitude of minute ventilation persisting for more than 60% of the exercise period. Oscillation amplitude for this purpose is defined as:
EOV has only been observed in patients with heart failure and the cause of heart failure does not seem to be a factor. When matched with individuals with similar levels of heart failure, patients that exhibit EOV tend to have:
- higher left atrial volume
- higher right-sided heart pressures
- higher Ve-VCO2 slope
- lower peak Ve
- lower peak VO2
- lower PETCO2
- higher Vd/Vt
- an attenuated tidal volume response to exercise
- a higher mortality rate
Early research indicated that individuals with EOV tended to have a low left ventricular ejection fraction (i.e. less than 0.30). It’s not clear this is actually the case since more recent research has shown EOV occurring in some individuals with an ejection fraction greater than 0.40.
The causes of EOV remain unclear. Researchers have noted that in heart failure the components of the ventilatory control system are altered by information delay (prolonged circulation time), increased controller gain (overactive chemoreceptors) and a decrease in damping (impaired arterial baroreflex). A recent study hypothesized the elevated right-sided heart pressures promotes baseline hyperventilation with hypocapnia. When PaCO2 is driven below the apnea threshold the patient hypoventilates which in turn causes PaCO2 to rise and hyperventilation to resume. This may well be the case but this doesn’t explain why only some patients with elevated right-sided heart pressures develop EOV nor does it explain why the periodicity of oscillation remains relatively constant across a wide range of workload, cardiac output, ventilation and VO2.
From a practical viewpoint I’ve found that the presence of EOV makes it difficult to determine anaerobic threshold (AT) and the Ve-VCO2 slope. AT is usually calculated using the V-slope technique or by the nadir in Ve/VO2. I have always found the inflection point in the V-slope technique to be relatively subtle and for this reason have always felt that the Ve/VO2 nadir provided a clearer signal but since both Ve/VO2 and Ve/VCO2 oscillate along with Ve determining the nadir (i.e. which nadir?) becomes problematic. At least one researcher noted that using V-slope technique they were able to determine AT in only 34% of their patients with EOV compared to 72% of those without.
For a variety of reasons I calculate the Ve-VCO2 slope by entering results into a spreadsheet and using a linear regression function to calculate the actual slope and intercept. Below the anaerobic threshold Ve and VCO2 tend to have a very linear relationship. Plotting the Ve and VCO2 from the patient with EOV I found it to have much greater scatter than usual which makes it unclear whether the Ve-VCO2 slope calculated from linear regression was accurate or not. This is potentially important in this case because the patient was near the upper limit of normal and a slight increase in slope would have put them over the ULN.
Finally, because of oscillation, the VO2, VCO2 and Ve at peak exercise may or may not be the actual maximum. The ATS/ERS recommendations on exercise testing say that you should average the last 30 seconds of peak exercise data to obtain the maximum VO2 but this may be occurring at a nadir in the oscillation. When I review CPET test data I compare the maximum values to the 30 second averages and will replace the peak values in the report if it appears to be necessary but I always have concerns about doing this.
EOV is something that can be seen in an exercise test with a greater or lesser frequency depending on your patient population. It tends to be evident only when Ve, Vt, VO2 and VCO2 are plotted versus time. Although EOV may appear to be the result of a variable patient effort it is highly periodic and its rate tends to remain constant as long as it persists. It is associated with advanced heart failure and most researchers have indicated that the presence of EOV helps to pinpoint patients with an elevated level of risk and for this reason its presence should be included in the CPET report.
References:
Ben-Dov I, Sietsema KE, Casaburi R, Wasserman K. Evidence that circulatory oscillations accompany ventilatory oscillations during exercise in patients with heart failure. Am Rev Respir Dis 1992; 145: 776-771.
Corra U, Giordano A, Bosimini E, Mezzani A, Piepoli M, Coats AJS, Giannuzzi P. Oscillatory ventilation during exercise in patients with chronic heart failure. Clinical correlates and prognostic implications. Chest 2002; 121: 1572-1580.
Koike A, Shimizu N, Tajima A, Aizawa T, Fu LT, Watanabe H, Itoh H. Relation between oscillatory ventilation at rest before cardiopulmonary exercise testing and prognosis in patients with left ventricular dysfunction.
Leite JJ, Mansur AJ, de Freitas HFGm Chizola PR, Bocchi EA, Terra-Filho M, Neder JA, Lorenzi-Filho G. Periodic breathing during incremental exercise predicts mortality in patients with chronic heart failure evaluated for cardiac transplantation. J Am Coll Cardiol 2003; 41(12): 2175-2181.
Olson LJ, Arruda-Olson AM, Somers VK, Scott CG, Johnson BD. Exercise oscillatory ventilation: instability of breathing control associated with advanced heart failure. Chest 2008; 133: 474-481.
Yajima T, Koike A, Sugimoto K, Miyahara Y, Marumo F, Horoe M. Mechanisms of periodic breathing in patients with cardiovascular disease. Chest 1994; 106: 142-146.

PFT Blog by Richard Johnston is licensed under a Creative Commons Attribution-NonCommercial 4.0 International License.