I’ve had several exercise tests come across my desk lately where the patient had an elevated Ve-VCO2 slope. An elevated Ve-VCO2 slope during exercise is usually taken as a sign of pulmonary vascular disease however these patients had a normal DLCO so I have been reviewing the literature to try to get a better understanding of what the Ve-VCO2 slope is trying to tell us in these cases.
Although the majority of the literature on Ve-VCO2 response indicates that it is likely due to some form of pulmonary vascular disease (micro-fracturing of the pulmonary capillaries, increased pulmonary vascular resistance, V-Q mismatching) there are some investigators that feel that in some individuals it is more likely due to an increased ventilatory chemosensitivity to CO2. It has been over 25 years since I last performed a CO2 response test and at that time there was no particular consensus on how the test should be performed. Since chemosensitivity may have a distinct bearing on Ve-VCO2 slope I thought it would be a good idea to also review the literature on CO2 response and see what has happened in the meantime.
After spending some time reading a couple dozen research papers it doesn’t seem as if much has changed. The CO2 Response landscape remains without an overall consensus and if anything has become more confusing, not less. There are two major approaches to measuring CO2 response and each of these approaches has at least two ways of analyzing the test data.
CO2 response was initially measured by having a subject breathe a series of gas mixtures containing specified concentrations of carbon dioxide (sometimes in room air, sometimes in oxygen). Ventilation was measured after alveolar gas had washed out and a steady state PetCO2 had been achieved, usually around 5 minutes. This was a laborious process, requiring not only only the time to make the measurement but for the subject to return to normal before the next level was tested. A re-breathing technique was first proposed by Read in 1967 and most research since that time has been based in one way or another on this approach.
The basic idea is that a large capacity anesthesia bag is filled with a mixture of 7% CO2 and 93% O2. The volume of gas in the bag is determined by the patient’s vital capacity plus 1 liter. The patient starts by breathing room air and the end-tidal CO2 is measured. The patient is then switched into the bag and as they re-breathe the gas mixture the CO2 concentration rises. As the level of CO2 increases, the patient’s minute ventilation increases as well. The test generally lasts around four minutes and is terminated when the CO2 concentration reaches 10% or the patient can no longer tolerate the sensation of dyspnea.
The first CO2 re-breathing response tests systems were primarily mechanical in nature. This is an example of a typical bag-in-a-box system:
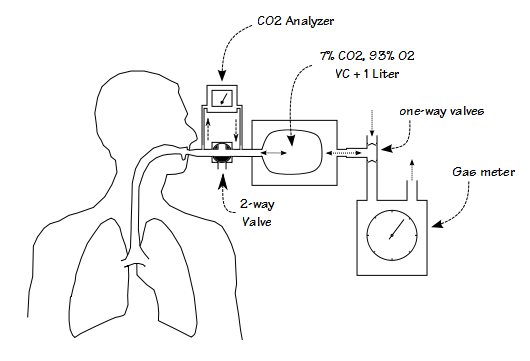
More recently, researchers have simplified the test system by re-purposing metabolic measurement systems originally intended for exercise testing:
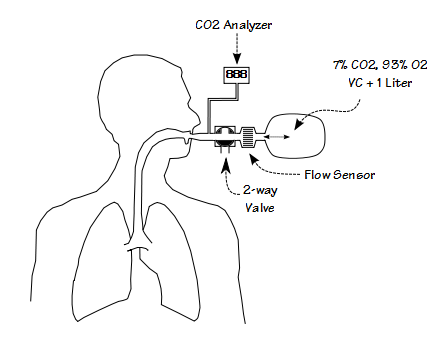
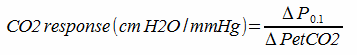
The primary measurements in these systems is end-tidal CO2 (PetCO2) and minute ventilation (Ve). CO2 response is calculated by:
![]()
Measuring the response to CO2 in this way has been criticized because patients with lung disease may be limited in their ability to increase their ventilation. For this reason, correction factors based on the patient’s maximum predicted minute ventilation have been developed. For example:
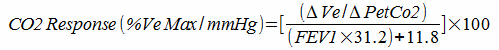
When expressed this way the results from patients with lung disease who would otherwise be expected to have an intact respiratory drive appear to more closely match those of patients with normal lungs.
Other investigators have argued that ventilation alone is not an accurate indication of respiratory drive and have instead advocated the use of inspiratory pressure. One way in which respiratory drive manifests itself is by the amount of force muscles exert during inspiration. When a person’s airway is occluded without their knowledge there is a period between the time an inspiration begins and the point at which their nervous system realizes that no airflow is occurring and stops inspiring. This period is approximately 200 to 300 milliseconds long and inspiratory pressures measured during this time are supposed to reflect true respiratory drive. Investigators have settled on the inspiratory pressure 100 milliseconds after the beginning of inspiration (P0.1 or P100) because it is long enough for the inspiratory muscles to be completely activated yet well before the time inspiration ends because of the occlusion.
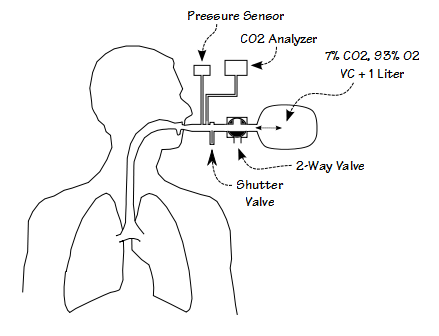
The testing system consists of a pressure sensor, a fast-acting shutter valve, a two-way valve and the re-breathing bag. The shutter valve is designed to be as quiet as possible and is kept out of the patient’s range of vision. This is because if the patient anticipates that the shutter valve will be closed they will alter their inspiration. P0.1 is measured by waiting until end-exhalation, closing the shutter valve, measuring the inspiratory pressure 100 milliseconds after the beginning of inspiration which is taken as the point where airway pressure goes negative, and then re-opening the shutter valve 200-300 milliseconds after that. P0.1 is measured first while the patient is breathing room air. The patient is then switched into the re-breathing bag. P0.1 is measured at irregular intervals (again to prevent anticipation of the shutter valve closing) until CO2 reaches 10% or the patient can no longer tolerate the sensation of dyspnea. CO2 response is then calculated as:
As with the ventilatory approach to measuring CO2 response, this method has been criticized because patients with neuromuscular disease or who for other reasons (i.e. flat diaphragm in COPD) have a limited inspiratory force would appear to have a lower respiratory drive. For this reason correction factors based on the patient’s MIP have been developed.

An individual’s response to CO2, however it is measured, is a critical component in their ventilatory response to exercise. Why after all these years of study hasn’t it become a standard clinical test? First, because as I’ve already mentioned there is no consensus on how to measure and how to calculate it. There are two major techniques (three if you count the stead-state approach) and within each of these techniques at least two ways to calculate the results and correct for underlying conditions. The test systems used to measure CO2 response also differ not just between techniques, but within each technique as well.
More importantly, there is no clear consensus on what a normal response is. A review of an admittedly limited number of articles for Ve/PetCO2 response has shown that normal values range anywhere from 1.3 +/- 1.0 to 3.8 +/- 1.0. L/min/mmHg. For P0.1 I’ve found a range of 0.17 +/- 0.11 to 0.60 +/- 0.10 cmH2O/mmHg. To confound this even more, individual CO2 response has also been shown to depend on, among other things, fatigue, meal composition and the time of day it is measured. Because of the lack of an accepted normal range, studies usually compare groups of normals subjects to patients with a specific condition. A problems with this is that in many cases the range of normal values is significantly greater than the between-group differences for normals and patients with such diverse problems as obesity, sleep apnea, CHF and COPD.
Finally, it should be remembered that the true drive to respiration comes from arterial PCO2 (and pH) and that end-tidal CO2 is just a convenient substitution. This fact alone creates a level of uncertainty for the results from almost all CO2 response studies.
I have no doubt that CO2 affects ventilation. I have no doubt that certain medical conditions can affect an individual’s response to CO2. I have no doubt that an individual’s response to CO2 can affect their exercise ventilation. The only thing that is clear however, is that when it comes to measuring CO2 response, there is no clarity.
What I am left with is a great deal of uncertainty about how much the exercise Ve-VCO2 slope is affected by an individual’s response to CO2 and how much it is affected by the individual’s underlying conditions. At the moment I am going to have to leave it that the only time I can truly suspect that an elevated CO2 response is a factor for an elevated Ve-VCO2 slope is only when there is no evidence for any form of pulmonary vascular disease, but it’s going to have to be left as a suspicion because I don’t see a way to verify it.
References:
Altose MD, McCauley WC, Kelsen SG, Cherniak NS. Effects of hypercapnia and inspiratory flow-resistive loading on respiratory activity in chronic airways obstruction. J Clin Invest 1977; 59: 500-507.
Berkenbosch A, Bovill JG, DeGoede AD, Olievier ICW. Ventilatory CO2 sensitivities for Read’s rebreathing method and the steady-state method are not equal in man. J Physiol 1989; 411: 367-377.
Elliot MW, Mulvey DA, Green M, Moxham J. An evaluation of P 0.1 measured in mouth and oesophagus during carbion dioxide rebreathing in COPD. Eur Respir J 1993; 6: 1055-1059.
Mador MJ, Tobin MJ. The effect of inspiratory muscle fatigue on breathing pattern and ventilatory response to CO2. J Physiol 1992; 455: 17-32.
Read DJC. A clinical method for assessing the ventilatory response to carbon dioxide. Aust Ann Med 1967; 16: 20-32.
Rebuck AS. Measurement of ventilatory response to CO2 by rebreathing. Chest 1976; 70(1): S118-S121.
Sin DD, Jones RL, Man GC. Hypercapnic ventilatory response in patients with and without obstructive sleep apnea. Do age, gender, obesity and daytime PaCO2 matter? Chest 2000; 117: 454-459.
Tomita T, et al. Attenuation of hypercapnic carbon dioxide chemosensitivity after postinfarction exercise training: possible contribution to the improvement in exercise hyperventiatiion. Heart 2003; 89: 404-410.
Whitelaw WA, Derenne JP, Milic-Emili J. Occlusion pressure as a measure of respiratory centre output in conscious man. Respir Physiol 1975; 23: 181-199.
Zwillich CW, Sahn SA, Weil JW. Effects of hypermetabolism on ventilation and chemosensitivity. J Clin Invest 1977; 60: 900-906.

PFT Blog by Richard Johnston is licensed under a Creative Commons Attribution-NonCommercial 4.0 International License.
Hi Richard, I have just discovered your blog and am enjoying it. I’m a respiratory physiotherapist doing fulltime research in the UK and had some limited experience of doing carbon dioxide response curves during my PhD. I was hoping the field would have moved on, but your blog suggests not. I have been hypothesising for many years that there is a subgroup of people with asthma who may be abnormally sensitive to small changes in CO2 and that this might help identify those who derive benefit from interventions like breathing control techniques – but the difficulties/issues you describe mean that it is still almost impossible to test the theory. Do let me know if things ever become any clearer!
Anne –
Simply because there is no consensus on how to perform response to CO2 testing and no accepted normal values doesn’t mean that you can’t perform the tests. I think you need to be careful in how you define sensitivity and you would have to compare results with normal subjects using the same methodology. Two suggestions: first, I haven’t seen anybody looking at changes in inspiratory flow rates (PIF, MIF50 or FIV1) with an increased FiCO2 and it seems to me that they would be somewhat between inspiratory occlusion pressure (P100) and minute ventilation, and perhaps somewhat easier to measure. Second, since mouthpieces and valves add their own bias to the tests what about optical plethysmography?
– Richard