Gas solubility and why it matters

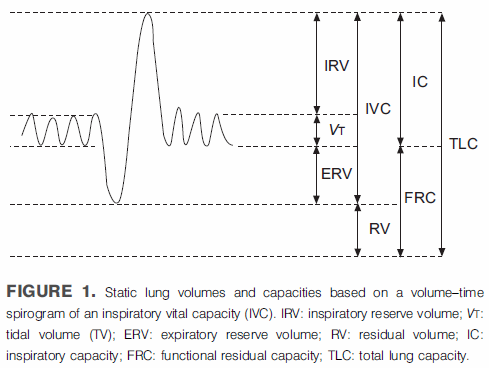
I have been searching through Pulmonary Function videos on YouTube in order to find ones I thought would be useful for technician education. So far what I’ve found have been intended either for medical students or for patients and not, in my opinion, particularly suitable for training technicians. Lately I’ve been looking at videos about lung volumes and have seen a half dozen presenters describe lung volume subdivisions using the same graph we’ve come to know and love with varying degrees of effectiveness and obfuscation.

From "Standardisation of the measurements of lung volumes", pg 512

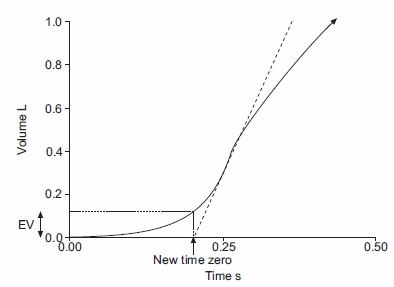
From “Standardisation of the measurements of lung volumes”, pg 512

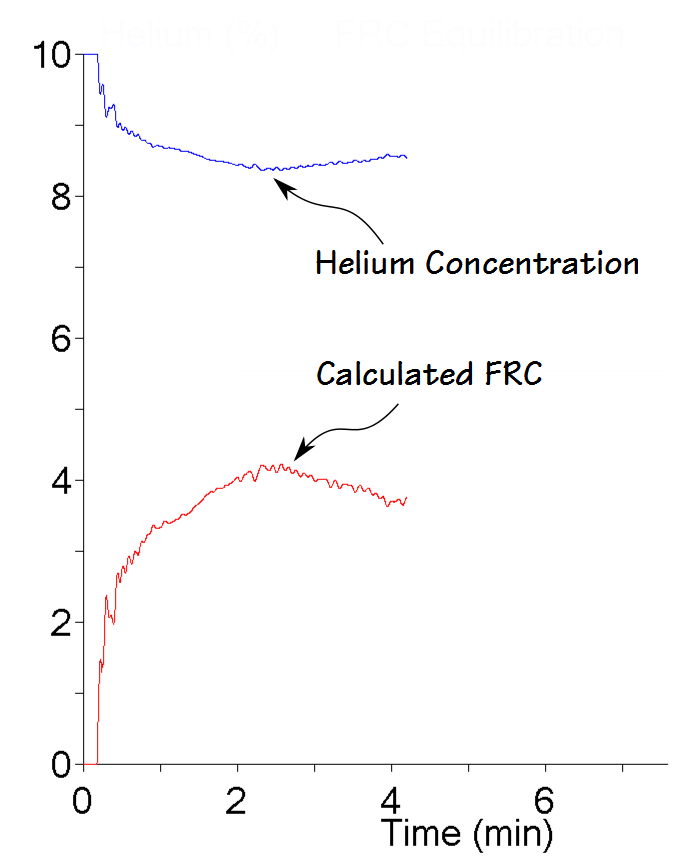
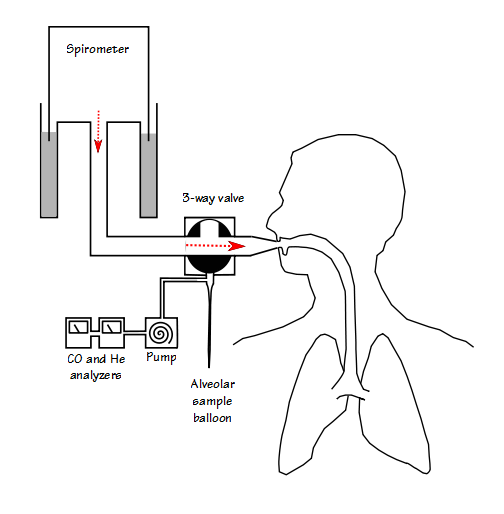
In a discussion of helium dilution lung volume measurements one of the presenters made an interesting statement and that was that “helium does not pass the alveolar-capillary barrier which means it stays inside the lungs during the test”. This is wrong on multiple levels. First, the alveolar-capillary membrane evolved for gas exchange and does not discriminate against individual gases so there is no barrier. Second, the reason that gases can be used as tracer gases or as probes of pulmonary circulation has entirely to do with gas solubility. Third, since it was a university-sponsored video with other egregious errors (for example did you know that lung volumes are measured in ml/kg?) what the heck are they teaching their medical students?

Gases can and will be absorbed by blood and tissue. The quantity of gas that can be absorbed is determined by the gas’s solubility and the Bunsen solubility coefficient is a measure of how much gas is absorbed (usually in milliliters of gas per milliliter of liquid) when the gas is at 1 atmosphere of pressure. When there is a multi-gas mixture, the quantity of gas absorbed for individual gas is calculated by:

Gas Content Calculation

Continue reading

It wasn’t a leak

The most common problem we have with helium dilution FRC tests are leaks. Although the system tubing and spirometer bell leak occasionally, we do have valve failures relatively frequently. Valve failures are usually obvious but they sometimes only fail partially so leak checks are regularly performed on these test systems. We can’t perform leak checks on patients except while they are being tested however, and patient leaks are far more common than system leaks.

A technician asked me to look at a patient’s helium dilution FRC test because it had an odd helium tracing. The technician was sure the patient had been leaking but the FRC from this test was was actually the lowest of three tests and they weren’t sure why that was the case.

Once I saw it I was immediately able to tell the technician that it wasn’t a leak and that it was probably okay to report the results. I was able to say this because when there is a leak during a helium FRC test the helium constantly decreases and never plateaus. The rate of decrease may change but the most pertinent point is that the helium concentration never plateaus and even more importantly, it never increases.

Helium Tracing

I’ve seen this particular type of helium tracing before but to be sure I could properly explain what caused it I downloaded a table of system readings from the test software and they verified that what I thought happened was probably correct.

Continue reading

How should predicted TLC and RV be derived?

The ATS-ERS standards on lung volume measurements says that measured TLC and RV can be calculated either by

RV = FRC – ERV then TLC = RV + SVC

or by

TLC = FRC + IC then RV = TLC – SVC

with the preference going to the first method. Strictly speaking, given the same FRC and SVC measurements either method is going to end up with exactly the same calculated TLC and RV values. Conceptually speaking I believe that TLC = FRC + IC is a more relevant way to think about TLC but this is only because I think that patients find it easier to perform a quality IC maneuver than a quality ERV maneuver.

A while back I found out that the predicted TLC in my lab’s test systems was being derived from the predicted RV from one set of equations and the predicted FVC from another set of equations (i.e. predicted TLC = predicted RV + predicted FVC). This is likely done so that there will be no discrepancy between the predicted FVC and predicted SVC on reports. I am not sure this is the correct decision since SVC does tend to be slightly larger that FVC but the difference is admittedly small (<1%) in healthy subjects so it is not likely to be significant.

Does it matter, however, for predicted TLC and RV which value’s reference equation you start with and which FVC reference equation you use with them? 

There are, of course, many different reference equations for lung volumes and spirometry, but to keep this simple I will choose the ones that I think are the most common and most relevant. For a 50 year old, 175 cm Caucasian male therefore, the predicted lung volumes look like this:

Equation: TLC FRC RV SVC
Quanjer 6.90 3.42 2.16 4.74
Crapo 6.74 3.60 1.98 4.76

Continue reading

DLCO: Sample balloon versus real-time gas analysis

The manager of a nearby PFT Lab made an interesting statement recently, and that was that DLCO measurements made with a sample balloon were superior to those made with a real-time gas analyzer. I think that he is biased to some extent by the fact that the manufacturer of his lab’s testing systems only supports the sample balloon approach to DLCO testing and so that is what he is used to. The same can be said of me however, because all of my lab’s equipment performs DLCO tests using real-time gas analysis and that is what I am used to.

I think that each approach has some benefits and some weaknesses but I’ll start first with a bit of background. When the single-breath DLCO test was standardized in more-or-less it’s current form in the mid-1950’s, the only gas analyzers available at that time were slow. They required relatively large samples of gas (>100 ml) and took over 10 seconds to settle to their final reading. The only way to perform the DLCO test was to capture a sample of alveolar gas and then analyze the entire sample.

In a very simplified view, a sample balloon DLCO system works something like this:

Inhalation to TLC

Inhalation to TLC

Continue reading

Zero offset in DLCO: system error or patient physiology?

I’ve noticed for a while that there has often been more variance between DLCO tests than I’d like to see. Some of this is of course attributable to differences in the way the patient performs each test. I am not overly surprised to see tests with different inspired volumes, different breath-holding times, different inspiratory times etc. etc. produce different results (in fact I am surprised that so many tests that have been performed differently frequently end up with almost identical results).

All too often though, I see tests that look like they were performed identically and yet have noticeably different results. For this reason I have been paying attention to small details to see if I can understand why this variance has been happening. I am well aware that there are “hidden” factors such as airway pressure (Valsalva or Mueller maneuvers) and cardiac output that can affect pulmonary capillary blood volume and therefore the DLCO. It is quite possible that much of the test-to-test variation is a result of these kinds of factors but I’ve also found several test system software and hardware errors that have lead to differences as well.

I am annoyed to say that I’ve found what could either be another system error or possibly a patient physiological factor that can lead to mis-estimated DLCO results. I’m annoyed not because I found it but because I’ve been looking at the DLCO test waveforms for a long time and never noticed this problem before. Of course since I’ve noticed it I now see it frequently.

Continue reading

FRC baseline shift affects TLC and RV

The plethysmographic technique for measuring lung volumes determines FRC first and then uses a slow vital capacity maneuver to calculate TLC and RV. FRC is defined as the volume of the lung at the end of a normal exhalation. The two components of the SVC maneuver that are used to calculate TLC and RV are the Inspiratory Capacity (IC) and the Expiratory Reserve Volume (ERV) and they too are measured relative to FRC. It would therefore seem to be important to have an accurate notion as to where FRC is in relation to TLC and RV when measuring lung volumes.

From ATS-ERS Standardisation of lung volume measurements, page 512

From ATS-ERS Standardisation of lung volume measurements, page 512

Plethysmography measures lung volumes by having a patient pant against a closed shutter and measuring pressure changes. The test is usually performed by having the patient breathe tidally for a period in order to determine where end-exhalation (FRC) is located, closing the shutter and performing the measurement, then returning to tidal breathing and performing the SVC maneuver. A critical assumption in this process is that the FRC baseline does not change while the shutter is closed.

Continue reading

CO2 response testing, still crazy after all these years.

I’ve had several exercise tests come across my desk lately where the patient had an elevated Ve-VCO2 slope. An elevated Ve-VCO2 slope during exercise is usually taken as a sign of pulmonary vascular disease however these patients had a normal DLCO so I have been reviewing the literature to try to get a better understanding of what the Ve-VCO2 slope is trying to tell us in these cases.

Although the majority of the literature on Ve-VCO2 response indicates that it is likely due to some form of pulmonary vascular disease (micro-fracturing of the pulmonary capillaries, increased pulmonary vascular resistance, V-Q mismatching) there are some investigators that feel that in some individuals it is more likely due to an increased ventilatory chemosensitivity to CO2. It has been over 25 years since I last performed a CO2 response test and at that time there was no particular consensus on how the test should be performed. Since chemosensitivity may have a distinct bearing on Ve-VCO2 slope I thought it would be a good idea to also review the literature on CO2 response and see what has happened in the meantime.

After spending some time reading a couple dozen research papers it doesn’t seem as if much has changed. The CO2 Response landscape remains without an overall consensus and if anything has become more confusing, not less. There are two major approaches to measuring CO2 response and each of these approaches has at least two ways of analyzing the test data.

Continue reading

What does Peak Flow have to do with back-extrapolation?

Well, everything, actually. Surprisingly enough they are intimately related to each other.

One of my current projects is to develop specifications for computer software designed to analyze spirometry results. Determining the “real” start of a spirometry effort using back-extrapolation is a critical part of accurately measuring FEV1 and all other timed values (FEV3, FEV6, TET). The ATS-ERS statement on spirometry includes recommendations for the back-extrapolation process, but this explanation shows its roots in old-school volume-time oriented spirometry:

“For manual measurements, the back extrapolation method traces back from the steepest slope on the volume-time curve. For computerized back extrapolation it is recommended that the largest slope averaged over an 80-ms period is used.” 

ATS back extrapolation

From: ATS/ERS Standardisation of Spirometry, page 324.

I was thinking about how to write software to do this when it occurred to me that the steepest slope of the volume-time curve is by definition the peak flow. This is probably something like re-inventing the wheel because I am sure this has been noticed before (probably by all the programmers that have done this before me) but I’ve never seen it written up this way.

Continue reading

What’s normal about RV and what does this have to do with TLC?

A physician associated with my PFT lab has become an investigator for a device study intended for patients with severe COPD. One of the major criteria for patients to be able to enroll in this study is a severely elevated Residual Volume (RV). Patients who have met this criteria at other PFT labs in New England have been referred to this study but when they have been re-tested in my lab their Residual Volumes are coming out lower and almost none of these patient have met this criteria. We have been asked why this is the case because they are now having difficulty finding patients that qualify for the study.

We have not been given access to the original PFT reports for these patients and have not been able to actually compare results on a case by case basis. For this reason we can only offer two possible reasons. First, that my lab may not be using the same reference equations for RV that other labs are. Second, that these patient’s RV’s may have been overestimated at other labs because of errors in testing.

To compare predicted RV’s I was able to find a dozen different reference equations for RV in adult males and females. These equations are mostly for Caucasian populations, but I was also able to find at least one reference equation each for Black, Asian, Indian, Iranian and Brazilian populations as well.

Continue reading

DLCO overestimated from a pre-test leak

We’ve been aware of this particular issue for several years. My PFT lab has had some turnover lately and the newer staff aren’t familiar with this problem so it has re-appeared in some of the reports I have been reviewing.

Our lab has a mix of flow-based and volume-based test systems. This problem is peculiar to only the volume-based systems that have a vertically mounted volume-displacement spirometer and is due in part to mechanical issues but also to some underlying assumptions made by the test software.

Continue reading