Well, everything, actually. Surprisingly enough they are intimately related to each other.
One of my current projects is to develop specifications for computer software designed to analyze spirometry results. Determining the “real” start of a spirometry effort using back-extrapolation is a critical part of accurately measuring FEV1 and all other timed values (FEV3, FEV6, TET). The ATS-ERS statement on spirometry includes recommendations for the back-extrapolation process, but this explanation shows its roots in old-school volume-time oriented spirometry:
“For manual measurements, the back extrapolation method traces back from the steepest slope on the volume-time curve. For computerized back extrapolation it is recommended that the largest slope averaged over an 80-ms period is used.”
From: ATS/ERS Standardisation of Spirometry, page 324.
I was thinking about how to write software to do this when it occurred to me that the steepest slope of the volume-time curve is by definition the peak flow. This is probably something like re-inventing the wheel because I am sure this has been noticed before (probably by all the programmers that have done this before me) but I’ve never seen it written up this way.
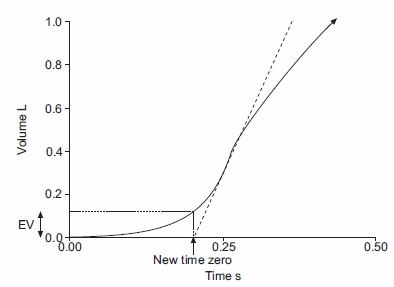
The software algorithm for back-extrapolation turns out to be very simple. Asssuming that the spirometry effort has already been digitized and that an array of paired flow and volume data points is available, the software performs a rolling 80-millisecond average of through the flow data and stops when the highest average expiratory flow (Peak Flow) has been found. Using the volume and time from the center of the averaging period, the back-extrapolated time zero is:
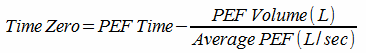
and the extrapolated volume is the volume in the array at time zero.
This got me to thinking about some of the details of the back-extrapolation process. The ATS-ERS back-extrapolation specifications are based on time (80 milliseconds), not on volume. This means the volume over which the back-extrapolation slope is averaged scales with the peak flow and not with the FEV1 or FVC or any other spirometry value.

This also means that the back-extrapolation slope volume is small when peak flow is low and large when peak flow is large. When the slope volume is low the potential for error in the calculated slope probably increases. This probably doesn’t make a significant difference in the determination of time zero but it adds a level of uncertainty I wasn’t aware of.
The back-extrapolation precess makes sense when you are thinking about a spirometry effort in terms of volume and time, but when a spirometry effort is viewed as a flow-volume loop, it is evident that the peak flow itself occurs within a short period of time and that flow rates can change significantly within the volume used to define the slope of the back-extrapolation.
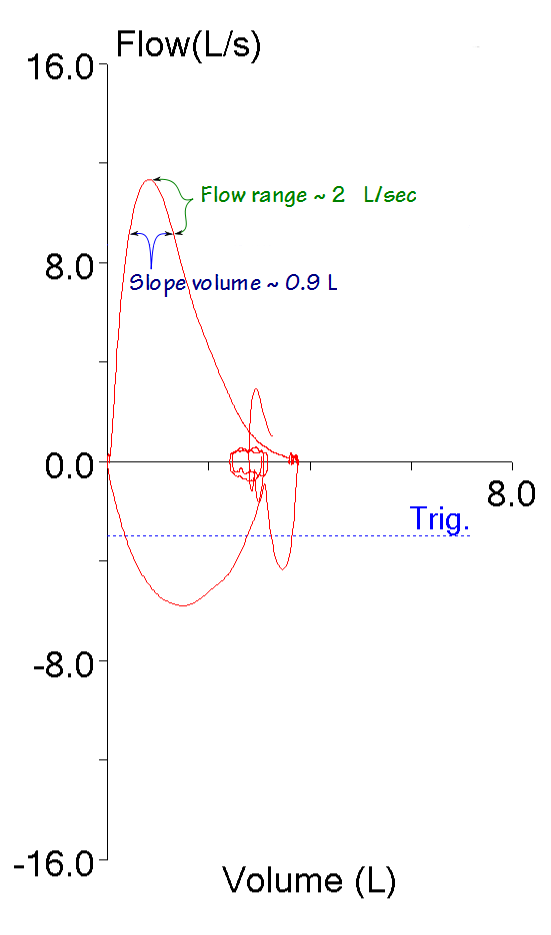
It’s possible that this volume when viewed in a volume-time curve would look flat, but it is quite evident that it isn’t. This makes it far from clear to me exactly what slope it is that we are back-extrapolating.
Does any of this make the ATS-ERS back-extrapolation process incorrect? Probably not. I fully understand the need for back-extrapolation. The start of a forced vital capacity maneuver cannot be instantaneous and there needs to be a standardized way of determining a starting point for measuring time. Given the threshold for an acceptable extrapolated volume (5% of the FVC or 0.15 L, whichever is greater) and the wide variety of expiratory flows and volumes that are seen in spirometry this process performs reasonably well. What is clear however, is that the back-extrapolation process has its roots in a time when a felt-tip pen attached to a water-seal spirometer traced a volume-time curve on graph paper and we had to put a ruler next to the tracing and draw a line to back-extrapolate the “real” beginning of a spirometry effort. That process depended on the eye of the technician drawing the line and although the process is now computerized some of the parameters (like the 80 millisecond averaging period) are still relatively arbitrary.
References:
Brusasco V, Crapo R, Viegi G. ATS/ERS Standardisation of Lung Function Testing: Standardisation of Spirometry. Eur Respir J 2005; 26: 319-338.

PFT Blog by Richard Johnston is licensed under a Creative Commons Attribution-NonCommercial 4.0 International License.