Hyperoxic CPETs

In patients with lung disease the use of supplemental oxygen during exercise increases oxygen consumption, endurance time and maximum workload, and decreases the sensation of dyspnea without increasing minute ventilation and maximum heart rate. My lab is occasionally asked to perform a CPET with an elevated FIO2 (hyperoxic CPET). We are capable of doing this but I’ve always had reservations, partly about the logistics involved in performing the CPET but more importantly with the interpretation of the results.

First, although it is certainly possible to perform some kinds of exercise test while the patient gets oxygen via a nasal cannula or mask, adding oxygen during a CPET requires that the patient breathes a hyperoxic gas mixture through their mouthpiece. Most commonly this is done by adding a two-way valve to the test system that is in turn attached to a reservoir bag which is filled from an oxygen blender.

CPET_Oxygen

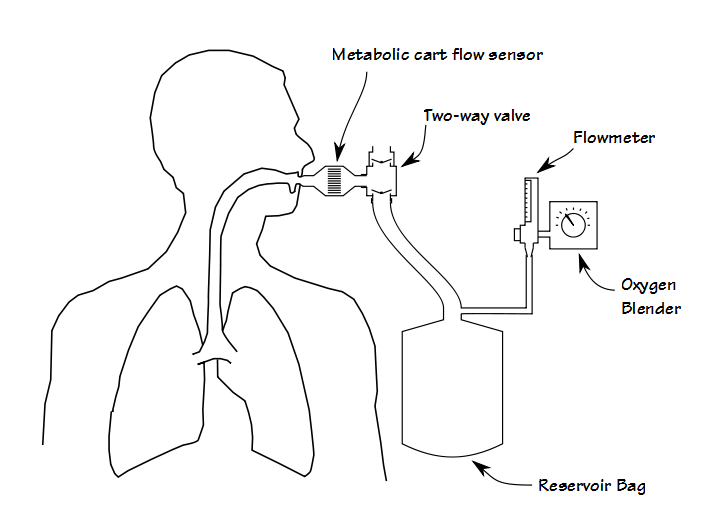
Although functional, this adds extra dead-space and the valves add extra resistance, both of which increases the patient’s work of breathing. From a practical standpoint it also adds a fair amount of extra weight to the breathing manifold, often more than is comfortable for the patient. This means that some method for supporting the manifold must also put in place. About 25 years ago I performed CPETs using a treadmill that had a support arm and at that time the approach recommended by the equipment manufacturer was to suspend the breathing manifold using rubber tubing. This worked in that it supported the weight of the breathing manifold, but it didn’t do anything about its mass or inertia and when a patient transitioned from a walk to a jog, the mouthpiece manifold would bang against the patient’s teeth and mouth.

Continue reading

Treadmill protocols

Since I started performing exercise tests I’ve used both treadmills and bicycle ergometers. There are a several reasons that make ergometers somewhat better for exercise testing than treadmills. Most importantly the reduced noise and physical motion makes it easier to get blood pressure measurements and better quality ECG’s. In addition the workload can be set fairly precisely and they are safer for patients. Treadmills do have some advantages however, since patients are usually able to achieve a higher maximum oxygen consumption (~10%) and for many individuals walking is more natural than riding a bicycle.

When I’ve used a treadmill for exercise testing I’ve always used one version or another of the Bruce protocol. This choice was made by my medical directors but it has always seemed to get patients to their maximum exercise capacity within a reasonable period of time and it seemed to provide reasonable workloads for patients over a broad range of physical abilities. About a dozen years ago (the last time my PFT lab was moved) we no longer had room for a treadmill and replaced it with an ergometer. Since then, I haven’t thought much about treadmills and treadmill protocols.

Recently I was talking with a physician who is going to be performing exercise research with a treadmill. When he showed me the treadmill protocol he was planning on using I thought that the initial speed (3.3 MPH) was too high. Since his study population is going to consist of obese, deconditioned asthmatics, I suggested that for patient safety that it would be better to start at a lower speed and elevation. He asked if I could suggest a different treadmill protocol but I had to reply that all I had ever used was the Bruce protocol.

This brought up an interesting question however, and that is whether there is any such thing as an optimal treadmill protocol. To answer this question I undertook a broad survey of treadmill protocols and have to say that the answer is probably no. Strictly speaking, each treadmill protocol is intended for a specific range of physical effort and the selection of any one protocol has to be based on the expectations and limitations of a patient’s physical abilities.

Continue reading

The effects of Obesity on lung function

Obesity has become far more commonplace than it was a generation ago. The reasons for this are unclear and have been attributed at one time or another to hormone-mimicking chemicals in our environment, altered gut biomes, sedentary lifestyles or the easy availability of high calorie foods. Whatever the cause, obesity affects lung function through a variety of mechanisms although not always in a predictable manner.

Spirometry:

Many investigators have shown a relatively linear relationship between an increase in BMI and decreases in FVC and FEV1. These decreases are small however, and FVC and FEV1 tend to remain within normal limits even in extreme obesity. The decreases in FEV1 and FVC tend to be symmetrical which is shown by the fact that the FEV1/FVC ratio is usually preserved in obese subjects without lung disease. Several studies have shown that the decreases in FVC and FEV1 are reversible since a decrease in weight showed a corresponding increase in FVC and FEV1.

In one study a 1 kg increase in weight correlated with a decrease in FEV1 of approximately 13 ml in males and 5 ml in females. The same increase in weight correlated with a decrease in FVC of approximately 21 ml in males and 6.5 ml in females. The greater change in FVC and FEV1 in males than females has been attributed to the fact that males tend to accumulate extra weight primarily in the abdomen.

The notion that abdominal weight has a disproportionate effect on lung function is seconded to some extent by studies that have shown that decreases in FVC and FEV1 correlated better with increases in waist circumference and the waist to hip ratio than with BMI. One study showed a 1 cm increase in waist circumference caused a 13 ml reduction in FVC and an 11 ml reduction in FEV1 across a range of elevated BMI’s.

Continue reading

Looking at the past, looking to the future

As New Year’s Day approaches it is a tradition for people look back to see what has happened during the last year and then look forward and guess what will happen during the next year. I’ve never done a New Year’s blog before but I’ve been mulling over a number of ideas for a while and this looks like a good place to explore them.

I’ve had the opportunity over the last several years to research the history of pulmonary function testing. There are a couple of interesting lessons from the past that may be useful, particularly when we are trying to guess what direction pulmonary function testing is heading towards in the future.

The spirometer as we know it and the measurement of the Vital Capacity began with John Hutchinson in 1846. In a sense there was really nothing new in what he did. His spirometer was a modified gasometer that had been invented by James Watt in 1790 and used by other researchers (notably Humphrey Davy who was the first person to measure the Residual Volume). The Vital Capacity had also been measured previously by many individuals. The remarkable thing that Hutchinson did however, was to present the first true population study and to clearly show the relationship between age, height and the Vital Capacity.

Measuring the Vital Capacity took off like a rocket and researchers all across Europe and the United States studied it in many different diseases and locations. An incredibly wide variety of spirometer technologies were developed as well, some of which are still in use. Over and over again researchers tried to show the value of the Vital Capacity (particularly in Tuberculosis) but the reality is that the clinical value of the Vital Capacity is quite limited. This is because when you only look at the volume of the Vital Capacity there are many reason why it can be reduced and so the finding of a reduced Vital Capacity is non-specific. The clinical use of spirometers languished for decades and the biggest use of spirometers wasn’t clinical at all, they were instead mostly used in schools, gymnasiums and penny arcades to measure lung “power”.

Continue reading

When it’s FVC 1, EOT 2, volume comes out short

I was reviewing a pre- and post-bronchodilator spirometry report that showed a relatively large increase in FVC but the change in FEV1 was not significant. It’s not impossible for a patient to show this kind of a pattern following a bronchodilator but it is somewhat unusual. Usually when I see this it means that the patient exhaled a lot longer post-BD than they did pre-BD. When I looked however, I saw that just the opposite was true, the expiratory time was actually shorter for the post-BD effort than it was for the pre-BD effort.

FVC_Error_Table

The reported expiratory time isn’t always accurate, though. When a patient stops exhaling during an FVC effort but doesn’t inhale our test system will sometimes continue to time the effort. When this happens the volume-time curve becomes flat and the expiratory time is reported with a falsely high value.

FVC Early Termination

This is what I expected to see when I looked at the volume-time graphs for this report. What I saw instead was this:

Continue reading

Is it Dynamic Hyperinflation or something else?

Patients with COPD often have a ventilatory limitation as their primary limitation to exercise. A ventilatory limitation to exercise has traditionally been assessed by the breathing index or the breathing reserve:

breathing index = Peak Ve / Predicted MVV

breathing reserve = 1 – (Peak Ve / Predicted MVV)

which are basically two different ways of saying the same thing. In either case a breathing index greater than 85% or breathing reserve less than 15% is an indication that a patient has reached a ventilatory limit to exercise. There is some disagreement as to whether the predicted MVV should come from a MBC test performed by the patient or from the patient’s FEV1 x 40. I have tried both approaches and my experience has been that FEV1 x 40 is the best indicator for a patient’s predicted MVV. This is also Wasserman’s (my go-to source for exercise testing) recommendation so this is what we use.

Individuals with COPD are occasionally hyperinflated at rest (i.e. elevated FRC and RV) and more commonly they dynamically hyperinflate during exercise. Research has shown that those individuals with are flow-limited during tidal breathing at rest almost always hyperinflate with exercise. Patients who are not flow-limited at rest but still have a low FEV1 and FEV1/FVC ratio may also hyperinflate. Because hyperinflation limits a patient’s tidal volume response to exercise it may cause an individual to have a limitation to exercise that occurs at a minute volume below the 85% threshold.

Exercise IC

Continue reading

Creepy decimal points

This is one of my pet peeves. It started for me back in the 1970’s when the Intensive Care Units where I was working were evaluating thermal dilution cardiac output meters. This was at a time when digital displays were just starting to become common. One of the meters showed cardiac output with two digits after the decimal point (i.e. 0.12) and the other one had three digits after the decimal point (i.e. 0.123).

Thermal dilution cardiac output works by threading a catheter (a Swan-Ganz is what was used at the time) with a thermistor in its tip through the right side of a patient’s heart into their pulmonary artery. A small amount of iced saline is then injected through the catheter and the system times how long it takes for this cold pulse to go around the patient’s body and return. There are a number of uncertainties involved so it’s not a terribly accurate technique and the very best you could ever expect would be a precision of about 1/10th of a LPM and that’s being very generous.

We had no ability to actually determine if either meter was accurate and the best we could see was that both meters gave similar results on the same patient. Neither meter was particularly harder or easier to use than the other. Nevertheless the cardiac output meter with 3 digits after the decimal point won the evaluation hands down because everybody said it had to be more accurate. This may say something about human nature but it’s also just nonsense. Simply because somebody places extra digits after the decimal point doesn’t make the measurement more accurate.

I’ve seen many times where a test result is reported with more digits after the decimal point than you could reasonably expect to get from the equipment or the measurement. When new devices (software or smartphones for example) add new features that are of little value (other than probably as ad copy) it is called feature creep. When this happens with digits I think this should be called decimal creep.

Continue reading

DMCO, Vc and 1/theta

Roughton and Forester’s seminal paper from the 1950’s showed that DLCO was a function of two resistances: the alveolar-capillary membrane and the rate of CO uptake by red blood cells. This relationship is shown by:

Formula 1 DLCO conductances

Roughton and Forster also showed that the membrane diffusing capacity (DMCO) and pulmonary capillary blood volume (Vc) could be calculated by performing the DLCO test at different oxygen concentrations and then plotting the results.

Modifed from: Pulmonary Function Testing Guidelines and Controversies, Jack Clausen ed., page 166.

Modifed from: Pulmonary Function Testing Guidelines and Controversies, published 1982, Jack Clausen ed., page 166.

Since the 1950’s DMCO and Vc have been measured for research fairly often. I first performed this test around 30 years ago mostly because I was interested in the technical aspects. I’ve tried to keep current with the research using DMCO and Vc ever since and have come to realize that there are several important details with a significant effect on how this test is performed and calculated.

Continue reading

Mixing doesn’t always make a match

Recently I was reviewing a spirometry report and noticed that the FVC was below normal. A low FVC can suggest a restrictive lung disease but the reported expiratory time was only about 4 seconds. I took a look at the graphics included with the report and the volume-time curve showed the effort ended well before 6 seconds so my first thought was that the reduced FVC was more likely because of suboptimal patient effort than anything else.

I always try to review spirometry results whenever there is anything questionable so I pulled up the raw test results and immediately saw that the reported FVC was actually a composite. The ATS-ERS statements on Spirometry and Interpretation say that the highest VC regardless of which test it came from (which even includes the slow vital capacity test from lung volume measurements and the inspiratory volume from a DLCO) should be used when reporting spirometry results. In this case the FVC came from one effort, the FEV1 and everything else came from a different effort. The interesting thing was that the effort the FVC came from was about 10 seconds long which shows it actually was an adequate effort. The FEV1 effort on the other hand was only about 4 seconds long and showed an abrupt and early termination of exhalation.

The technician who performed the tests selected the correct efforts to make a composite. The patient had made five spirometry efforts and the selected FVC was significantly larger than all of the other efforts but the FEV1 from the same effort was significantly lower than several other efforts. Our criteria for selecting FEV1 does not just go by the largest FEV1, we also look at the peak flow (PEF) and whether there has been any back extrapolation and the effort the FEV1 came from had the highest peak flow and no back extrapolation. So, a good choice had been made on both efforts.

When it comes to selecting values from different spirometry efforts there are only a limited number of results that our lab software allows us to mix and match. The FVC, the FEV1 and the graphics (flow-volume loop and volume-time curve which are linked to each other) can all be selected individually, but everything else, which includes the expiratory time, PEF, FEF25-75, MEF50 etc. etc. can only be selected as a group.

Continue reading

Single-breath DLCO Breath-holding time (BHT)

The single-breath DLCO maneuver can rightly be criticized as being an artificial maneuver that bears little resemblance to normal breathing. It is only by standardizing the maneuver that clinically relevant and reproducible results can be obtained. One important aspect of this standardization is the breath-holding period.

The single-breath DLCO maneuver begins with a subject exhaling to RV, followed by an inhalation of the test gas mixture to TLC and then a 10-second breath-holding period, ending with an exhalation during which a sample of alveolar air is collected. The initial choice of a 10-second breath-hold period was largely arbitrary and was selected in order to strike a balance between being a short enough period that for most patients to hold their breath, long enough to minimize the inspiratory and expiratory phases and long enough to allow for a sufficiently measurable amount of carbon monoxide to be taken up.

During the inspiratory phase of the DLCO maneuver, carbon monoxide uptake does not begin until the inhaled gas has passed both the test system’s and the subject’s anatomic dead space and reached the first functional alveolar-capillary unit. The full rate of carbon monoxide uptake will not occur until the diffusing gas mixture has reached all available alveolar-capillary units and these units have reached their maximum surface area. The rate of carbon monoxide uptake therefore increases throughout inhalation and reaches a maximum near TLC.

During the exhalation phase, carbon monoxide uptake continues even as the alveolar sample is being taken. For this reason the concentration of carbon monoxide at the beginning of the sampling period tends to be higher than at the end of the sampling period. The size of the washout volume and the alveolar sample volume, which to some extent determines how long a patient has to exhale before the acquisition of an alveolar sample is complete, will also have an effect on exhaled gas concentrations.

Because the point at which carbon monoxide uptake starts and the point at which it ends are to some degree indeterminate, several methods for standardizing the measurement of the single-breath DLCO breath-hold period have been developed. Of these, the Ogilvie method starts measuring the breath-hold period at the very beginning of inhalation and stops at the beginning of the alveolar sampling period. The Epidemiology Standardization Project (ESP) method, on the other hand, also stops at the beginning of the alveolar sampling period but instead starts measuring at 50 percent of the inhaled volume. Finally, the Jones-Meade method starts measuring at 30 percent of the inspiratory time and stops in the middle of the alveolar sampling period.

DLCO_03_03_BHT_Graph

Continue reading