Ventilatory response to hypoxia and hyperoxia

While reading a recently published article I found they had performed response to hypoxia and hyperoxia testing as part of the study. At one time or another in the past I’ve read about response to hypoxia testing but I’d never heard about hyperoxia testing before. I had some difficulty understanding their interpretation of the study’s results and for this reason I’ve spent some time reading up on the subject. I’m not sure this helped because there appears to be a lack of consensus not in only how to perform these tests but also in how they are interpreted, except perhaps in the most simplistic sense. Hypoxia and hyperoxia testing has been performed primarily to gain a deeper understanding of the way in which the peripheral (carotid) and central chemoreceptors function. There are a variety of sensor-feedback network models and results are often presented in terms of one model or another and this makes comparing results from different studies difficult. Interpretation and comparison is further complicated by the fact that results depend not only on the length of time that hypoxia or hyperoxia is maintained but whether the subject was exposed to hypoxia, hyperoxia or hypercapnia previously.

The ventilatory response to hypoxia tends to have three phases. First, once a subject begins breathing a hypoxic gas mixture within several seconds there is a rapid increase in minute ventilation known as the Acute Hypoxic Ventilatory Response (AHVR). Second, after several minutes there is a decrease in ventilation and this is usually called the Hypoxic Ventilatory Depression (HVD). Third, there is a progressive rise in ventilation after several hours which is related to acclimatization to altitude. It is the first phase, AHVR, that is most commonly measured during a hypoxic ventilatory response test. The actual length of time that is spent in any of these phases is widely variable between individuals and there is also a relatively large day-to-day variability within the same individual.
Continue reading

Asleep at the wheel

During this last week I was contacted by two different individuals who were asking for help in understanding their PFT results. In both cases they had a markedly elevated TLC and the interpretation included the notation that they had gas trapping and hyperinflation. Even though the amount of information they provided was minimal I am extremely skeptical that the TLC measurements were correct.

Gas trapping usually only occurs with severe airway obstruction. Hyperinflation, which at minimum consists of a chronically elevated FRC and RV, usually only occurs after prolonged gas trapping. An elevated TLC usually occurs only with prolonged hyperinflation and given the improvements in the care and treatment of COPD I’ve seen over the last several decades, has become relatively uncommon.

But one individual had perfectly normal spirometry:

%Pred:
FVC: 107%
FEV1: 112%
FEV1/FVC: 105%
TLC: 143%

Continue reading

A glitch in time

This relatively odd DLCO testing error came across my desk today. Although it’s fairly unusual it brings up some interesting points about how the Breath-Holding Time (BHT) is determined and what effect it has on DLCO.

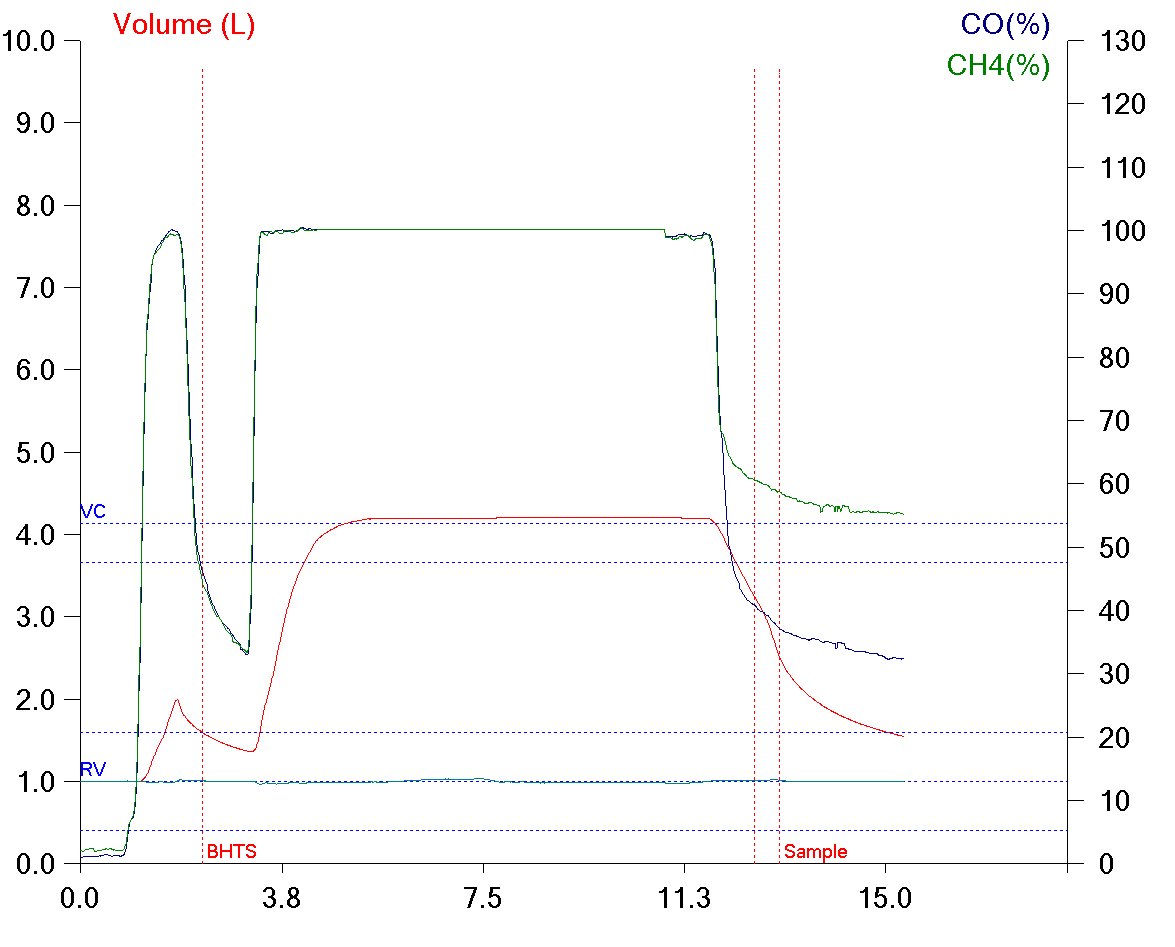
Specifically, at the beginning of the DLCO test the patient took a partial breath in, then exhaled, then took a complete breath in. The patient performed the DLCO test three times and did exactly the same thing each time despite being coached by the technician to only take a single breath in. I’m sure this says something about human nature but I’m not exactly sure what.

BHT_Glitch_1

Anyway, our test systems uses the Jones-Meade approach to measuring breath-holding time (the ATS/ERS recommendation). The J-M algorithm starts the measurement of BHT when the inhalation has reached 1/3 of the inspiratory time. In this case the computer detected the beginning of the first inspiration and detected when the patient had reached the end of inspiration (which is standardized at the point at which 90% of the final inhaled volume has been reached), but it ignored what happened in the middle. For this reason, the software set the beginning of the breath-holding time before the “real” inhalation.

Continue reading

Underutilized spirometry, missed opportunities

A friend is taking her father to a PFT lab (2500 miles away from where I am the moment so I couldn’t go along with them) because he has been short of breath for a couple of years, but oddly enough, only when lying on his side. I expect that despite these rather specific symptoms he will only get routine spirometry. I don’t necessarily fault the PFT Lab he’s going to for this, partly because physician orders often don’t include specifics, partly because they may not have the facilities to perform supine or lateral spirometry, and partly because its not clear lateral spirometry would show anything.

I don’t think that my lab is necessarily any better. We have only one room with an exam table that allows us to perform positional spirometry and that is largely because of the ALS patients we regularly see. Even so, unless we received specific orders to perform supine or lateral spirometry it’s unlikely that one of our technicians would think it was necessary and then take it on themselves to perform it. That itself is part of the problem not only for my lab but for the field of Pulmonary Function testing in general (but that’s another story).

The real problem however, is that the way in which spirometry is performed around the world is focused almost exclusively on detecting expiratory airway obstruction. It may be true that airway obstruction is primarily expiratory, but this ignores that fraction of individuals who have some degree of inspiratory obstruction. It also overlooks those individuals whose FVC is underestimated and FEV1/FVC ratio overestimated due to some degree of gas trapping. It also overlooks individuals that have positional airway obstruction that is not evident in the upright position.

We’ve fallen into the trap of thinking that there’s only one way to perform spirometry, and this is a mistake.

Continue reading

The clue was in the O2

One of the overlooked parts of teaching pulmonary function interpretation is developing an appreciation for the number and variety of errors that the equipment, patients and technicians can produce and how they affect the reported test results. I routinely run across a couple dozen errors each week while reviewing reports. Most are minor and do not significantly affect the reported results. Many are mundane because they appear so often and a few are interesting because they point out a particular limitation in the equipment, software or testing standards. I’ve kept a file of the more iconic examples of testing errors for years and a while ago a pulmonary staff physician and I used to hold weekly sessions for fellows and residents where we’d present a number of “zingers” to see if they could figure them out. Unfortunately that physician has moved on to a different institution and I’m no longer as available as I used to be so these sessions are no longer held but I think that they or something like them should be held in all teaching hospitals.

These spirometry results came from a middle-aged woman with sarcoidosis.

Observed: %Predicted: Predicted:
FVC: 3.55 155% 2.29
FEV1: 1.06 60% 1.77
FEV1/FVC Ratio: 30 39% 77

Elevated FVC’s are not all that uncommon (and are a good example of the limitations of reference equations), but one that is 155% of predicted is particularly unusual. This occurs most commonly when somebody has made an error in measuring or entering the patient’s height (I can’t tell you the number of times I’ve seem someone entering 60 inches when they meant 6 feet), but this patient has been seeing pulmonary physicians and having regular spirometry tests for over a decade and the height for this test was the same as it was for the previous visit. In addition the trend report showed that over the last year the patient’s FVC had been between 71% and 65% of predicted.

Transtracheal_O2_FVL

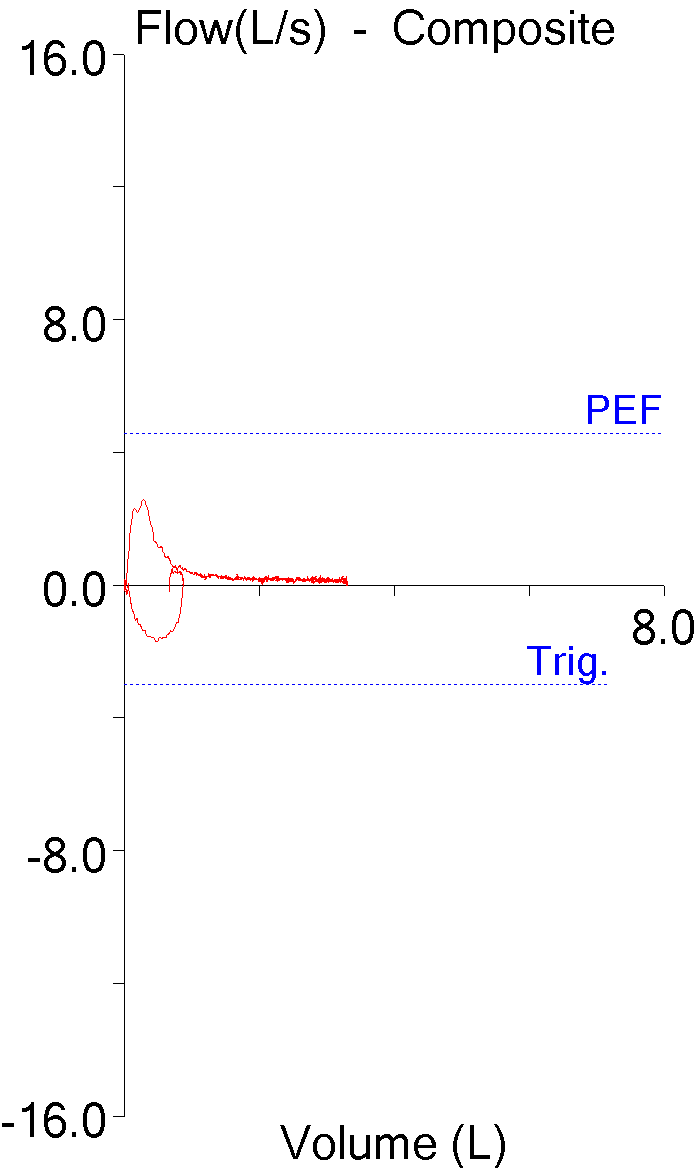
The flow-volume loop doesn’t look overly unusual although the expiratory flow doesn’t taper off to zero and the patient maintained a low expiratory flow for at least two-thirds of the vital capacity.
Continue reading

Helium overshoot, revisited

A while back one of our technicians brought a helium dilution FRC graph to my attention and wanted to know if it showed a system leak. At that time my response was that it definitely wasn’t a leak (leaks don’t show increases in helium) and was probably due to too much oxygen being added to the system at the beginning of the test.

Helium_Overshoot_01

A couple of days ago a technician brought a similar graph to me and again I was asked why it looked unusual. I’ve had time to think about this issue since the last time and I’ve come up with an alternate explanation that I think fits the facts a bit better.

A normal helium dilution curve looks something like this:

Helium_Overshoot_02_nl-ish

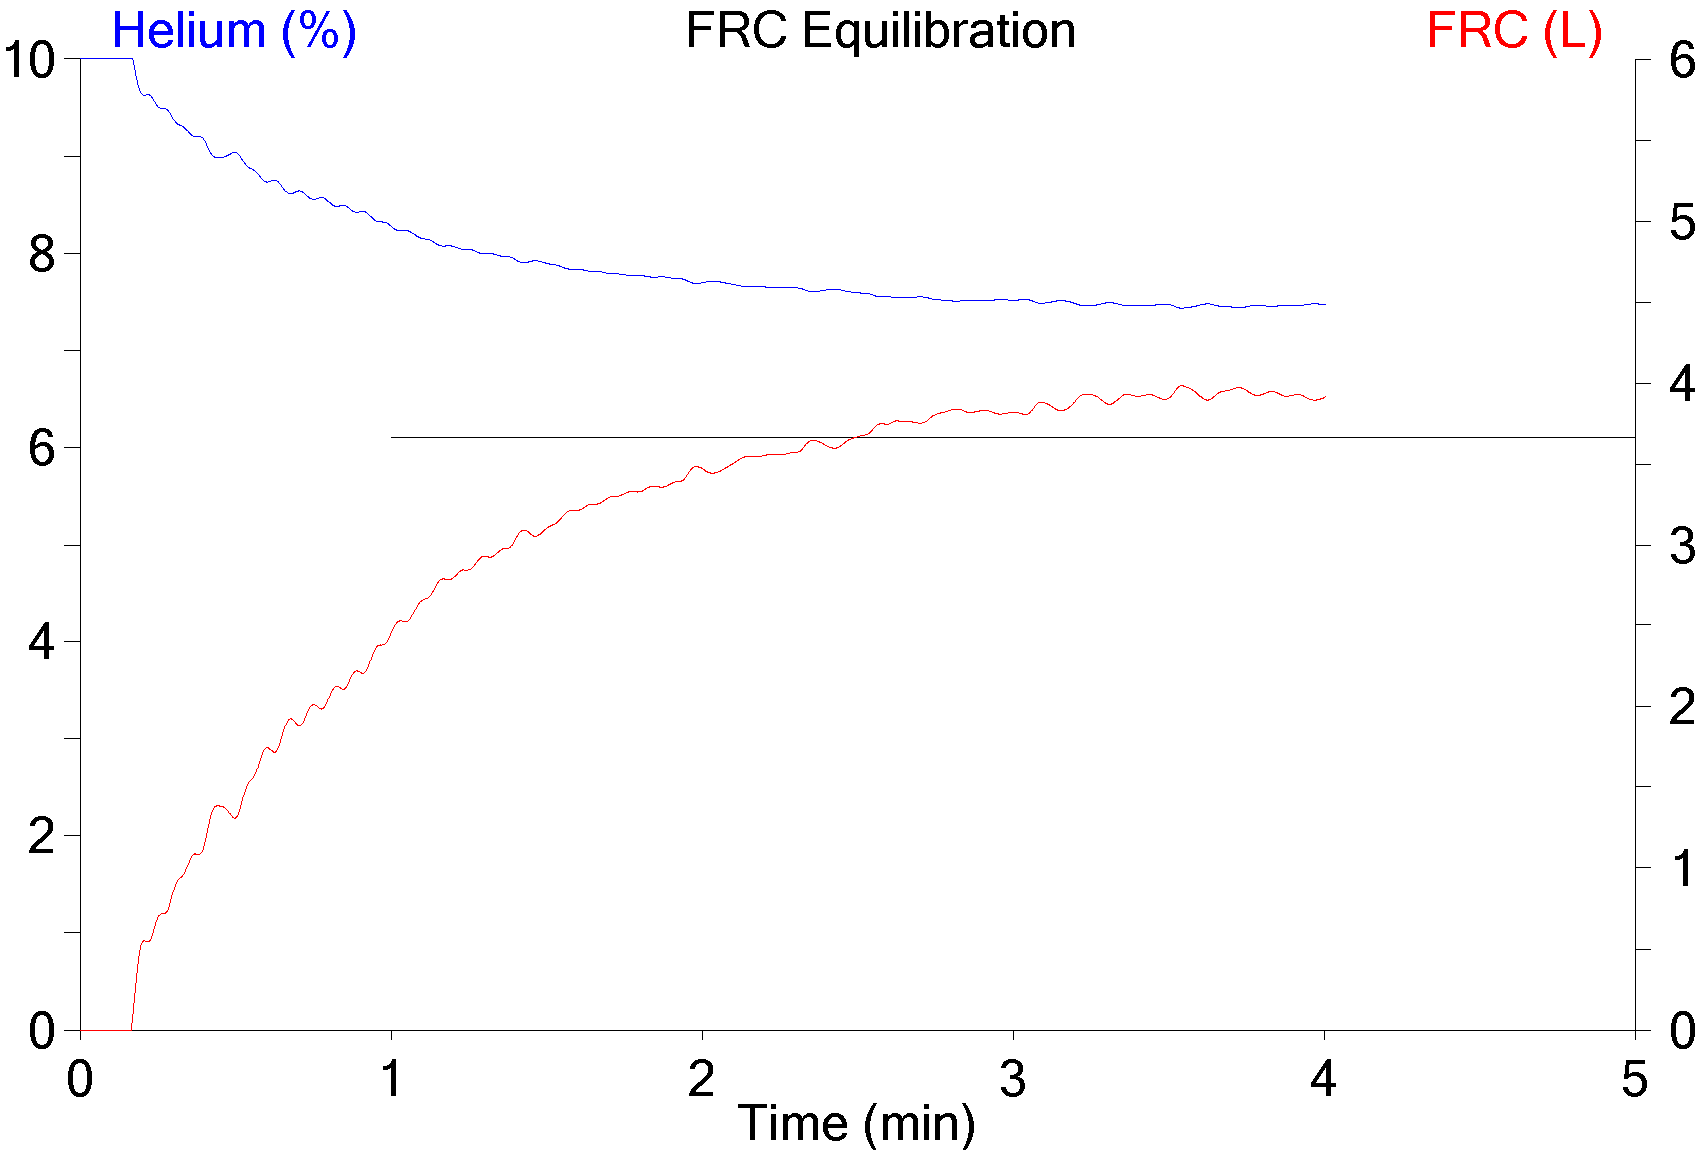
which shows the helium decreasing with what is more or less an exponential decay curve. What’s unusual about the other curve is that it shows a relatively rapid fall to the lowest helium concentration near the beginning of the test and then a slow rise to the final concentration.

Continue reading

Anatomic dead space

I’d spent some time researching single-breath tests a while back and of course ran across the Fowler method for measuring anatomic dead space. It’s a relatively simple test but assessing its results as well as the results of alternate dead space measurement techniques turns out to be more complicated than I had remembered.

The official definition of anatomic dead space is that it is that part of the inhaled volume that remains in the airways at the end of inhalation and does not participate in gas exchange. An accurate estimate of this volume is important because respiratory dead space (Vd/Vt, discussed previously) is composed of both anatomical and physiological dead space. The physiological component of the respiratory dead space cannot be determined without knowing the anatomical dead space.

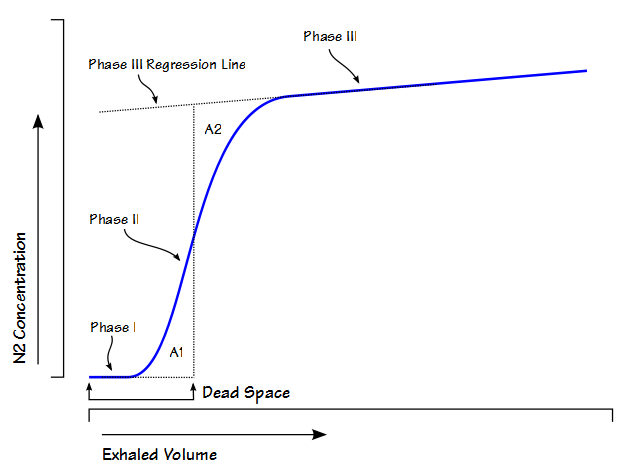
Anatomic dead space is usually considered to be the physical volume of the airways but static measurements of airway volume do not take into consideration the dynamic aspects of respiration. The most commonly used method for measuring anatomic dead space in a research setting is the single-breath technique developed by Fowler in 1948. In this method, after an inhalation of oxygen, the nitrogen concentration in an individual’s exhalation is plotted against exhaled volume.

Fowler Dead Space

Continue reading

DLNO isn’t the same as DMCO but sometimes it’s useful to pretend it (almost) is

Oxygen transport between the lungs and the body depends on numerous complex factors. Ventilation and the alveolar-capillary surface area are of course important but a critical component is hemoglobin. Oxygen is poorly soluble in water (which is what blood is mostly made of) and the transportation of oxygen throughout the body would not happen without hemoglobin’s ability to absorb and release oxygen on demand. Although it is possible to measure the diffusing capacity of oxygen (DLO2) the process is technically difficult and not at all suited to routine clinical testing.

There are a number of gases that are able to diffuse across the alveolar-capillary membrane and can be used in a variety of physiological measurements but in order for a particular gas to act as a substitute for oxygen it must be able to interact with hemoglobin. Carbon monoxide (CO) has an affinity for hemoglobin approximately 220 times greater than oxygen and was the first gas used to measure diffusing capacity (DLCO). DLCO has been a routine test for well over 50 years and has been measured by single-breath, steady-state and rebreathing techniques.

Nitric Oxide (NO) has an affinity for hemoglobin about 400 times greater than carbon monoxide (it is generally an irreversible process since the end product is methemoglobin whereas hemoglobin’s binding with CO is more reversible) and for this reason it can also be used to measure diffusing capacity. DLNO can also be measured by single-breath, steady-state and rebreathing techniques. Because of its high affinity and the speed at which the binding of NO to hemoglobin occurs numerous researchers have assumed that DLNO is equivalent to DMNO (the membrane component of diffusing capacity). This is not really true, but it can be a useful fiction and in order to understand why it’s necessary to look at the basic physiology of diffusing capacity tests.

Roughton and Forster’s seminal 1957 paper showed that diffusion is the sum of two resistances. I’ve discussed this previously but specifically:

1_over_DLCO_formula

Where:

DMCO = membrane component

θCO = the rate at which CO binds to hemoglobin

Vc = pulmonary capillary blood volume

The first resistance (1/DMCO) is the resistance to the diffusion of CO through the alveolar-capillary membrane and blood plasma to the surface of the stagnant plasma boundary layer around a red blood cell. The second resistance refers to the diffusion rate of CO through the plasma boundary layer, then the wall and interior of the red blood cell and finally the rate of reaction with hemoglobin.

DL_Resistances Continue reading

Temperature (in)correction

Sooner or later we all get lucky and find ourselves able to replace older equipment. When you have equipment that’s so old it can’t be repaired (either because the manufacturer no longer supports it or because the manufacturer no longer exists), you’d think this would be a no-brainer but money is always in short supply. I’ve often had to try to keep equipment running long past its expected life time and was only allowed to replace it when it finally broke beyond all hope of repair.

One of the reasons to perform biological QC is so that you can recognize changes in the equipment that don’t appear during a calibration. It also a useful (and recommended) way to assess new test equipment. So what happens when you finally get that new test system and your results are substantially different from what they were before?

I was recently contacted by the manager of an employee health service that had replaced their 18 year old spirometer with a brand-new one. When using their new spirometer they had found their biological QC results coming out noticeably lower (-9%) than they had gotten from their old spirometer and I was asked if I could help them determine why.

My first question was whether or not they were using the same 3 liter syringe to calibrate the different spirometers. Once I found out this was the case I then asked them to use the 3 liter syringe in test mode. The results from this were actually very informative. The old spirometer showed an average FVC of 3.24 liters and the new spirometer showed an average FVC of 3.06 liters.

Continue reading

Filter FUD

A lab manager recently emailed me and asked my opinion about whether it was okay to use generic mouthpiece filters on their test systems. They had asked the same question of their equipment manufacturer and received the following statement (parts of which have been redacted by me):

“The [model number] PFT system was designed/tested/certified using the [manufacturer’s] filter. While other “off-label” filters may fit our devices, they have never been tested or approved for use by [the manufacturer]. The precision and accuracy of our devices could be compromised by using different type filters. It is our recommendation that you continue to use the [manufacturer’s] approved filters with your PFT equipment.”

Since I doubt the manufacturer has tested their equipment with any other mouthpiece filters than those they sell this is in some ways a true statement. Having said that, it is also a statement designed to sow fear, uncertainty and doubt (FUD) in the minds of their customers about a subject that is relatively straightforward.

The human respiratory tract is a potential source of particles in the 0.1 to 20 micron range, particularly when coughing but even to some extent during quiet breathing. Mouthpiece filters are barrier filters and intended to prevent these particles from getting into PFT equipment. Filter manufacturer’s claims are very similar and usually state a “Bacterial filtration efficiency: > 99.999% and Viral filtration efficiency: > 99.99%”. In one sense this statement is somewhat disingenuous because mouthpiece filters are not tested with bacteria or viruses (which have diameters as small as 0.03 microns) directly, but are instead tested with aerosols generated by a nebulizer.

A HEPA (High Efficiency Particle Absorption) filter is a true bacterial filter and to meet standards it must filter out 99.97% of all particles 0.3 microns or larger. Mouthpiece filters are not HEPA filters, partly because of cost but far more importantly because HEPA filters have a lot of resistance to air flow. A HEPA filter is a sieve mouthpiece with opening sizes that prevent particles above a specific size from passing through. Mouthpiece filters instead work by impaction and electrostatic attraction. Larger particles are captured by impacting or otherwise being intercepted by the filter fibers and the fibers usually also have an electrostatic charge that attracts smaller particles.

Continue reading