Assessing MVV results

The Maximum Voluntary Ventilation (MVV) test was initially described in 1933. It was the first pulmonary function test that involved inspiratory and expiratory air flow in a significant way and for this reason it helped to set the stage both conceptually and technically for the FEV1, the FEV1/FVC ratio and our present understanding of obstructive lung diseases. MVV is reduced in a variety of conditions, including obstructive, restrictive and neuromuscular diseases, but a reduced MVV is non-specific and this limits its clinical utility. Nevertheless, it continues to be performed both in clinical labs and for research, and for this reason it would seem to be a good idea to know how to assess MVV results.

As usual, there are two aspects to assessing pulmonary function results; test performance and normal values.

Currently the ATS/ERS statement on spirometry contains the only available standard for performing the MVV test. Unfortunately this standard also contains some significant flaws. Its primary recommendation is that the MVV test be performed with a tidal volume that is approximately 50% of the forced vital capacity and a breathing frequency of around 90 breaths per minute. These recommended values are problematic and some simple mathematics will show why.

A respiratory rate of 90 BPM means that there is 2/3 of a second for both inhalation and exhalation. With a 1:1 ratio for inspiration and expiration, there is only 1/3 of a second for exhalation. Since it normally takes a full second to exhale approximately 75% of the vital capacity (i.e. the FEV1), 1/3 of a second would only allow time to exhale 25% of the vital capacity (not exactly true of course, but it helps prove the point). How then is it possible to exhale 50% of the vital capacity, twice that amount, in the same amount of time? The answer is that it isn’t and if it was somehow possible for somebody to actually meet the ATS/ERS recommended values they would have an MVV that would be 45% to 100% higher than any of the predicted MVV’s. I suspect the ATS/ERS agrees this is a problem since following the initial recommendation it also says that “… since there are little data on MVV acceptability criteria, no specific breathing frequency or volume is required”.

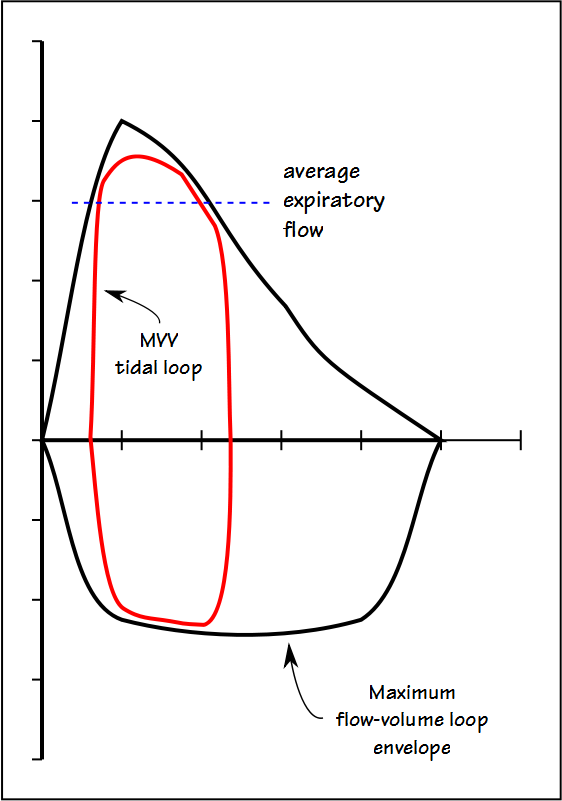
The fact is that no single tidal volume recommendation is going to work for all patients and this is because the MVV tidal volume has to reside mostly within the maximal flow-volume loop envelope.

MVV_TV_FVL_01

Continue reading

What’s abnormal about FRC?

I’ve had a number of reports across my desk in the last couple of weeks with both elevated and reduced FRC’s that were associated with a more-or-less normal TLC. I reviewed the raw data from all of these tests (I review the raw data from all lung volume tests) and in only a few instances did I make any corrections to the report. This made me think however, about what, if anything, is an abnormal FRC trying to tell us?

The answers to that question range from “a whole bunch” to “not much” to “darned if I know”. When you measure lung volumes TLC is really the only clinically important result. RV can be useful at times but although the other lung volume subdivisions may play a role in the measurement process they have only a limited diagnostic value. All lung volume measurements start with FRC, however, and if you don’t know you have an accurate FRC how do you know that TLC is accurate?

FRC is a balance point of opposing forces in the lung and thorax. Lung tissue wants to collapse, the rib cage wants to spring open and the diaphragm wants to do whatever muscle tone, gravity and the abdomen allows it to do. All of these forces are to one extent or another dynamic and can change over time. These changes can occur both slowly and rapidly, and are the primary reason why isolated changes in FRC don’t tend to have a lot of clinical significance. For all lung volume measurements however, one primary assumption is that FRC does not change during the test and this isn’t necessarily true.

Continue reading

When back-extrapolation goes astray

A spirometry report that looked very questionable came across my desk recently. The flow-volume loop was misshapen and the technician’s notes indicated that the results had been highly variable and to “interpret with caution”. I pulled up the raw test results and saw a series of test efforts with flow-volume loops that were all somewhat flattened and with no consistency in either the loops or the numerical results.

This kind of inconsistency can be an indication of poor patient effort but can also occur because of airway problems. The cardio-thoracic surgeons at my hospital have an active airway stenting program and so we see a fair number of patients with trachemalacia. One hallmark of tracheomalacia is that there is usually a flow limitation and that this means that there is usually a flat expiratory plateau in the flow-volume loops. These loops had peak flow-ish humps, but the humps seemed to appear in different locations in every loop and they seemed to have a relatively high frequency flutter.

Back_extrapolation_04_redacted

Back_extrapolation_06_redacted

One plausible explanation for the inconsistent results is vocal cord dysfunction (VCD). VCD is characterized by the paradoxical closure of the vocal cords that results in wheezing or stridor and shortness of breath. The gold standard for diagnosing it is laryngoscopy while the patient is symptomatic but it can be difficult to make a definitive diagnosis since symptoms can often come and go. VCD can mimic asthma but patients usually don’t respond to bronchodilators and have negative challenge tests. Spirometry results like these can only be suggestive, however.

The real problem though, was that the spirometry effort that had been selected for reporting indicated the patient had moderately severe airway obstruction (FEV1 56% of predicted) and there were several efforts that had a significantly higher FEV1. When I checked the numerical values it was apparent that this effort had been selected because it was the effort with the highest FEV1 whose back-extrapolation met ATS-ERS criteria.

Continue reading

Pneumotach accuracy

The first reasonably accurate flow-measuring device was the Fleisch pneumotachograph which was developed in 1925. Originally the Fleisch pneumotach bounced a light beam off a mirror mounted on a diaphragm and from there onto photographic film, all of which made it difficult to use. World War II saw the development of sensitive pressure transducers, amplifiers and recorders and by 1950 the pneumotachograph went totally electronic and began to be commonly used in routine pulmonary research.

The first spirometers that used a flow sensor came onto the marketplace around 1970. Since that time, flow sensors of one kind or another have made steady inroads and now the majority of test systems use flow sensors and there are only a small handful of volume-displacement spirometer systems still being manufactured.

There are a variety of difficulties involved with measuring gas flow rates and this has driven the development of a number of different flow measurement techniques. As well as the pneumotachograph, there are now Pitot tube, hot wire, turbine and ultrasonic flow sensors. Some of these techniques are more linear than others but none of them are perfectly linear.

The pneumotachograph however, is inherently the most linear method for measuring gas flow rates and has been more completely characterized than all other techniques. For this reason it is probably used in pulmonary function equipment more frequently than any of the other type of flow sensor and is also far more likely to be used in research.

Gas flow through a pneumotach is measured from the difference in pressure across a resistance. There are a variety of ways of creating this resistance but there are only two methods that are relatively linear, the Fleisch and the screen (aka Lilly) pneumotach.

The resistance in the Fleisch pneumotach consists of a set of narrow capillary tubes, parallel to the direction of flow.

Fleisch Pneumotach

Continue reading

What’s wrong with this picture?

I had mentioned previously that my PFT Lab has been questioned why the percent predicted Residual Volume (RV) measurements on some research patients were coming out so much lower at my lab than at some other PFT Labs. At that time the researchers had not shared the results they had from these patients so we could only speculate that either our RV’s were actually lower or that the predicted RV values used by the other PFT Labs were different than ours. We finally got a copy of the PFT report for one of these patients and it turns out that both answers were correct.

First, the predicted RV from what I will call Lab X (I am not familiar with the lab nor with any of the physicians or technicians there) was 15% lower than ours. My lab is using the reference equations from Stocks et al which are recommended by the ERS. I was unable to determine which sets of reference equations Lab X was using. They weren’t listed on the report and the calculated values didn’t seem to match any of the reference equations I have on hand. Our lab software uses the predicted RV plus the predicted Forced Vital Capacity (FVC) (from NHANESIII) to calculate predicted Total Lung Capacity (TLC). It is possible that Lab X’s software calculates the predicted RV by subtracting their predicted FVC from a predicted TLC.

I am not, however, going to try to argue that my lab’s predicted values are better than those of Lab X, just that they are different. The ATS has not officially recommended any particular set of lung volume reference equations and I think it would be easy to argue that all current reference equations are flawed to one extent or another. I would like to know how they were derived at Lab X but that is just to satisfy my own curiosity. Using Lab X’s predicted RV, our measured RV was 179% of predicted where by our reference equations it was 152% of predicted. This explains part of the difference in percent predicted values but by no means all of it.

When I looked at the actual test results from Lab X however, I saw numerous errors in the lung volume test and test calculations.

Continue reading

Zero offset in DLCO: system error or patient physiology?

I’ve noticed for a while that there has often been more variance between DLCO tests than I’d like to see. Some of this is of course attributable to differences in the way the patient performs each test. I am not overly surprised to see tests with different inspired volumes, different breath-holding times, different inspiratory times etc. etc. produce different results (in fact I am surprised that so many tests that have been performed differently frequently end up with almost identical results).

All too often though, I see tests that look like they were performed identically and yet have noticeably different results. For this reason I have been paying attention to small details to see if I can understand why this variance has been happening. I am well aware that there are “hidden” factors such as airway pressure (Valsalva or Mueller maneuvers) and cardiac output that can affect pulmonary capillary blood volume and therefore the DLCO. It is quite possible that much of the test-to-test variation is a result of these kinds of factors but I’ve also found several test system software and hardware errors that have lead to differences as well.

I am annoyed to say that I’ve found what could either be another system error or possibly a patient physiological factor that can lead to mis-estimated DLCO results. I’m annoyed not because I found it but because I’ve been looking at the DLCO test waveforms for a long time and never noticed this problem before. Of course since I’ve noticed it I now see it frequently.

Continue reading

What’s normal about RV and what does this have to do with TLC?

A physician associated with my PFT lab has become an investigator for a device study intended for patients with severe COPD. One of the major criteria for patients to be able to enroll in this study is a severely elevated Residual Volume (RV). Patients who have met this criteria at other PFT labs in New England have been referred to this study but when they have been re-tested in my lab their Residual Volumes are coming out lower and almost none of these patient have met this criteria. We have been asked why this is the case because they are now having difficulty finding patients that qualify for the study.

We have not been given access to the original PFT reports for these patients and have not been able to actually compare results on a case by case basis. For this reason we can only offer two possible reasons. First, that my lab may not be using the same reference equations for RV that other labs are. Second, that these patient’s RV’s may have been overestimated at other labs because of errors in testing.

To compare predicted RV’s I was able to find a dozen different reference equations for RV in adult males and females. These equations are mostly for Caucasian populations, but I was also able to find at least one reference equation each for Black, Asian, Indian, Iranian and Brazilian populations as well.

Continue reading

Marketing your PFT Lab

A writer posed an interesting question on the AARC Diagnostics forum several weeks ago and that was how to market their PFT Lab. I don’t think they got much of a response but I have been thinking about this since then.

I think that any good lab manager wants to see their lab succeed and grow. I’ve always felt that pulmonary function testing is an essential component of preventive care but that despite this PFT Labs are underutilized. In order to market your PFT Lab effectively you need to understand your customers and target your message accordingly. You also need to understand that you can’t get something for nothing. Marketing requires that you expend resources, whether it is just your time or includes lab budget money, in order to get any payback.

There are three target audiences for your marketing; patients, physicians and administrators. Each audience has a different question you must be able to answer. For patients the question is going to be “why do I need pulmonary function testing?”. For physicians it is going to be “why should I send my patients to your lab?” and for administrators it is “why should I devote resources to your lab?”.

Continue reading

Don’t ignore office spirometry

My PFT Lab has recently been asked by several doctor’s offices and clinics to advise them on the purchase of an office spirometry system. I am not a fan of office spirometry because I think the test quality is often low. Office spirometry is usually performed by poorly trained office staff using poorly maintained equipment and under these conditions quality is going to suffer. Despite my misgivings the reality is that office spirometry is not going away and in fact its use is probably expanding.

There are several good reasons why this is happening. More testing of all kinds is being done at the point of care and there is an increased awareness of standards of care for COPD and Asthma. There is also revenue generation (the websites of several office spirometer manufacturers have downloadable documents showing return on investment and the proper codes to use (ICD9 and CPT) when billing).

I think that we ignore this trend at our own peril and that the proper response should be to reach out and offer assistance in selecting office spirometers and training office staff to perform spirometry instead. Although this will require extra effort with no immediately apparent payback I think this should be done not only because it is the right thing to do for the patient’s sake but also because it will pay dividends in the long run.

Continue reading

DLCO overestimated from an apparent zero offset error

I’ve had some concerns for a while now about how the CO and CH4 concentrations are being calculated from the DLCO analyzer calibration zero offsets and gains on our test systems. For this reason I’ve been looking carefully at all of the raw data from our DLCO tests and today I came across an oddball test result. There are several reason why this is probably not the best example for this particular problem that I could come up with but it illustrates an important point and it’s in front of me so I’ll go with it.

In order to use the output from a gas analyzer you need to know the zero offset and the gain of the signal. Presumably the analyzer remains stable enough between the time it was calibrated and the time it is used for the zero offset and gain to be meaningful. When looking at the calibration data I’ve noticed that some of our test systems show relatively large changes in zero offset from day to day. These changes are still within the operating limits of the analyzer so no red flags have gone up over this. The test systems and analyzers are turned off over night so in order to see if the analyzers go through these kind of changes during a normal day I once did a series of calibrations each separated by five or ten minutes on one of the more suspect testing systems. What I saw was that although there were small changes from calibration to calibration, I didn’t see anywhere near the changes I’ve seen from day to day which at least implied that the analyzer remained reasonably stable during a given day.

Today a patient’s report came across my desk and as usual I took a look at the raw test results. What I saw was that two out of three of the DLCO tests had been performed with the correct inspired volume but that the one with a much lower inspired volume had a much larger VA and DLCO when compared to the other results. This got me scratching my head since the patient has severe COPD and that usually means that a lower inspired volume leads to a lower DLCO and VA. When I noticed the analyzer signals during the breath-hold period that’s when I could see right away why the results had been overestimated.

Continue reading