I had mentioned previously that my PFT Lab has been questioned why the percent predicted Residual Volume (RV) measurements on some research patients were coming out so much lower at my lab than at some other PFT Labs. At that time the researchers had not shared the results they had from these patients so we could only speculate that either our RV’s were actually lower or that the predicted RV values used by the other PFT Labs were different than ours. We finally got a copy of the PFT report for one of these patients and it turns out that both answers were correct.
First, the predicted RV from what I will call Lab X (I am not familiar with the lab nor with any of the physicians or technicians there) was 15% lower than ours. My lab is using the reference equations from Stocks et al which are recommended by the ERS. I was unable to determine which sets of reference equations Lab X was using. They weren’t listed on the report and the calculated values didn’t seem to match any of the reference equations I have on hand. Our lab software uses the predicted RV plus the predicted Forced Vital Capacity (FVC) (from NHANESIII) to calculate predicted Total Lung Capacity (TLC). It is possible that Lab X’s software calculates the predicted RV by subtracting their predicted FVC from a predicted TLC.
I am not, however, going to try to argue that my lab’s predicted values are better than those of Lab X, just that they are different. The ATS has not officially recommended any particular set of lung volume reference equations and I think it would be easy to argue that all current reference equations are flawed to one extent or another. I would like to know how they were derived at Lab X but that is just to satisfy my own curiosity. Using Lab X’s predicted RV, our measured RV was 179% of predicted where by our reference equations it was 152% of predicted. This explains part of the difference in percent predicted values but by no means all of it.
When I looked at the actual test results from Lab X however, I saw numerous errors in the lung volume test and test calculations.
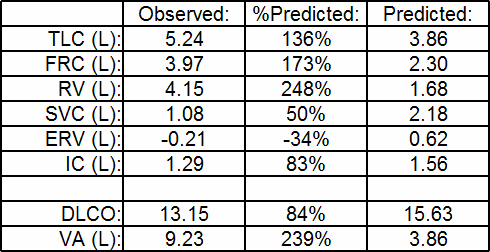
Lab X’s test results
For comparison, here are our results.
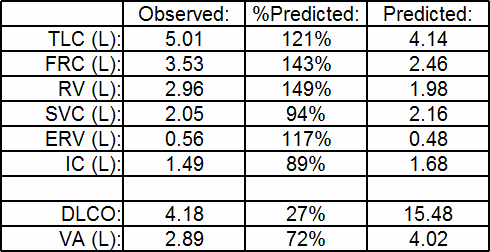
My lab’s results for the same patient
Regardless of anything I could say about the actual test quality (and these results are from a final report not the raw test data so there is not a lot I can say about it), it is evident that RV could not have been calculated correctly. The most significant errors in the results from Lab X are:
- a negative Expiratory Reserve Volume (ERV)
- an RV that is larger than the Functional Residual Capacity (FRC)
- an Inspiratory Capacity (IC) that is larger than the Slow Vital Capacity (SVC)
Really? And in what alternate universe is this kind of math okay?
So what went wrong? Since I don’t have access to the raw test data I have to speculate a bit but I am actually familiar with this error since I have seen it before.
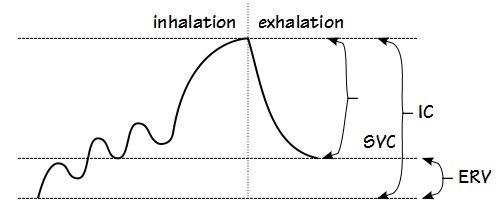
What is happening is that Inspiratory Capacity (IC) is calculated from the inspiratory part of the Slow Vital Capacity maneuver while the SVC and ERV are being calculated from the expiratory part of the maneuver. When this is performed correctly:
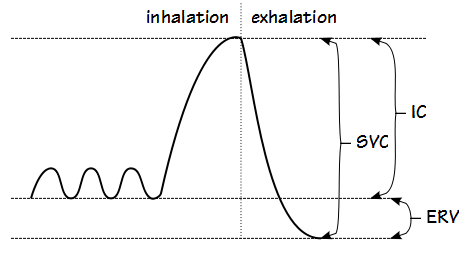
A properly performed SVC maneuver
IC and ERV are smaller than the SVC (and SVC = IC + ERV). If the patient does not exhale completely however, the SVC will be lower than the IC and the ERV will be negative (and oddly enough SVC will still be equal to IC + ERV).
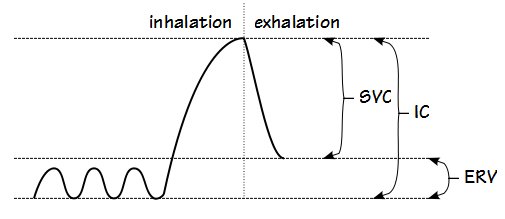
An SVC maneuver with an incomplete exhalation.
Alternatively, if the test system or the patient is leaking, even though the patient may actually perform the maneuver correctly the SVC, IC and ERV can be measured incorrectly and again SVC will be smaller than the IC and the ERV will be negative.
An SVC maneuver performed with a leak
Without the raw test data it’s not possible to say which of these scenarios is the correct one, but either one would explain the numerical results and in either case the RV would be calculated incorrectly and would be significantly overestimated. This means that the other reason our percent predicted values were coming out so much lower than Lab X’s was due to sloppy testing on their part.
One other thing I noticed on the report from Lab X was the DLCO. What immediately struck me was the exceptionally high VA (9.23 L, 239% of predicted). The patient has very severe airway obstruction (FEV1 <35% of predicted) and my experience is that VA is almost always underestimated (less than measured TLC) when airway obstruction is present and the amount of underestimation usually correlates with the degree of obstruction but in this report the VA was 176% of the measured TLC. When tested in my lab, the patient’s VA was much smaller (2.89 L, 72% of predicted and 58% of our measured TLC).
This says to me that something was very wrong with Lab X’s DLCO test. Again, all I have is the final report so it is not possible to say what the specific error or errors are, but since DLCO scales almost linearly with VA, this means that the DLCO was also likely significantly overestimated and in this case both Lab X’s VA and DLCO were 3.1 times larger than my lab’s.
So what’s wrong with this picture? The fact is that the ERV was negative, the RV was larger than the FRC, the IC was larger than the SVC and the DLCO’s VA was 176% of the measured TLC. These results were accepted first by the testing software. They were then approved by the technician performing the test. Next, they were reviewed and approved by the physician interpreting the test. Finally, they were reviewed by the research coordinators who in turn gave my lab flak about our test results.
Really? We’re the ones that got the flak?
Lung volume measurements are much more difficult than they look. I’ve been in this field for more than forty years yet I continue to find subtle (and not so subtle) errors caused by software, equipment, patients and technicians. The errors in this patient’s results were not subtle however. They are actually incredibly basic errors in math and test performance yet at every step along the way the results were approved and passed on and I really can’t think of a single good reason why. It would be easy to point the finger at the technician that performed the tests but there is more than sufficient blame to be spread at every level. The simple fact is that none of the individuals involved in this patient’s tests, and that includes the programmers, technician, lab manager, clinical director, interpreting physician and research coordinators, did their job correctly.
I am not a fan of PFT Lab licensure because I think there are already too many badly-written regulations and too much bureaucracy. I am not a fan of credentialing because I don’t think credentials necessarily prove you know how to do your job. And I’ve seen more than enough bad examples to give me skeptical view of both. After seeing this report from Lab X however, I may have to change my opinion. Licensure and credentialing won’t necessarily make problems like this go away but it at least might make them less likely.
References:
Hankinson JL, Odencrantz JR, Fedan KB. Spirometric reference values from a sample of the general U.S. Population. Am J Respir Crit Care Med 1999; 159: 179-187.
Stocks J, Quanjer PH. Reference values for residual volume, function residual capacity and total lung capacity. Eur Respir J 1995; 8: 492-506.

PFT Blog by Richard Johnston is licensed under a Creative Commons Attribution-NonCommercial 4.0 International License.
Hi Richard,
Hope you are doing well. After your last post, I have gone back to the beginning of your blog post and have been reading each one individually. Your resource and expertise will be missed. It is sad to see such reports, as in the case, sent out!!!!
Such events, highlight, the need for better understanding of pulmonary function.
“1+1=3” It is up to the techs to see that even though, these machines put out numbers- They can be wrong!
You’ve written about such a thing and I believe it was titled, “Falling asleep at the wheel.”
Best Regards and health,
Mo