What’s abnormal about FRC?

I’ve had a number of reports across my desk in the last couple of weeks with both elevated and reduced FRC’s that were associated with a more-or-less normal TLC. I reviewed the raw data from all of these tests (I review the raw data from all lung volume tests) and in only a few instances did I make any corrections to the report. This made me think however, about what, if anything, is an abnormal FRC trying to tell us?

The answers to that question range from “a whole bunch” to “not much” to “darned if I know”. When you measure lung volumes TLC is really the only clinically important result. RV can be useful at times but although the other lung volume subdivisions may play a role in the measurement process they have only a limited diagnostic value. All lung volume measurements start with FRC, however, and if you don’t know you have an accurate FRC how do you know that TLC is accurate?

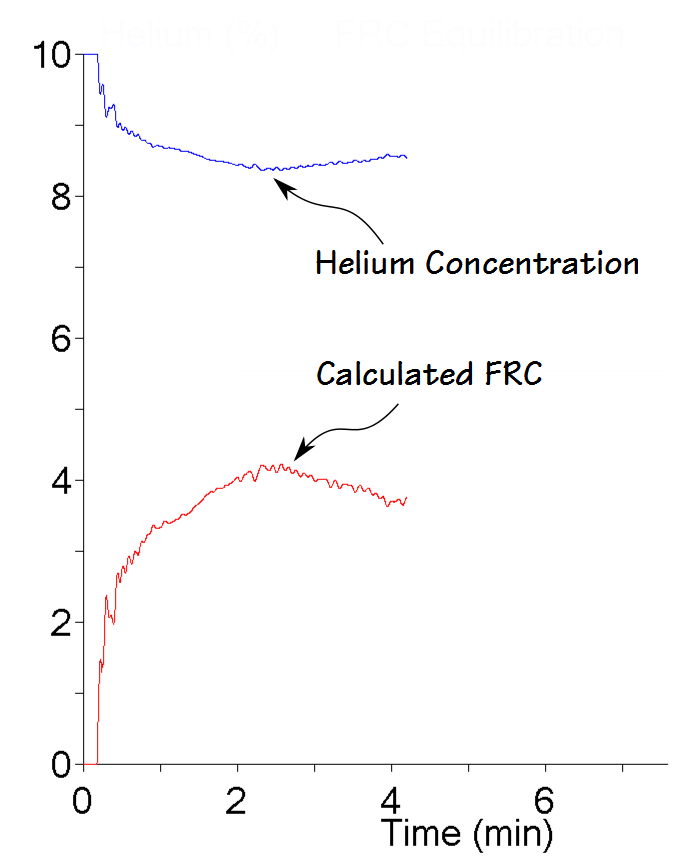
FRC is a balance point of opposing forces in the lung and thorax. Lung tissue wants to collapse, the rib cage wants to spring open and the diaphragm wants to do whatever muscle tone, gravity and the abdomen allows it to do. All of these forces are to one extent or another dynamic and can change over time. These changes can occur both slowly and rapidly, and are the primary reason why isolated changes in FRC don’t tend to have a lot of clinical significance. For all lung volume measurements however, one primary assumption is that FRC does not change during the test and this isn’t necessarily true.

Continue reading

Gas solubility and why it matters

I have been searching through Pulmonary Function videos on YouTube in order to find ones I thought would be useful for technician education. So far what I’ve found have been intended either for medical students or for patients and not, in my opinion, particularly suitable for training technicians. Lately I’ve been looking at videos about lung volumes and have seen a half dozen presenters describe lung volume subdivisions using the same graph we’ve come to know and love with varying degrees of effectiveness and obfuscation.

From "Standardisation of the measurements of lung volumes", pg 512

From “Standardisation of the measurements of lung volumes”, pg 512

In a discussion of helium dilution lung volume measurements one of the presenters made an interesting statement and that was that “helium does not pass the alveolar-capillary barrier which means it stays inside the lungs during the test”. This is wrong on multiple levels. First, the alveolar-capillary membrane evolved for gas exchange and does not discriminate against individual gases so there is no barrier. Second, the reason that gases can be used as tracer gases or as probes of pulmonary circulation has entirely to do with gas solubility. Third, since it was a university-sponsored video with other egregious errors (for example did you know that lung volumes are measured in ml/kg?) what the heck are they teaching their medical students?

Gases can and will be absorbed by blood and tissue. The quantity of gas that can be absorbed is determined by the gas’s solubility and the Bunsen solubility coefficient is a measure of how much gas is absorbed (usually in milliliters of gas per milliliter of liquid) when the gas is at 1 atmosphere of pressure. When there is a multi-gas mixture, the quantity of gas absorbed for individual gas is calculated by:

Gas Content Calculation

Continue reading

It wasn’t a leak

The most common problem we have with helium dilution FRC tests are leaks. Although the system tubing and spirometer bell leak occasionally, we do have valve failures relatively frequently. Valve failures are usually obvious but they sometimes only fail partially so leak checks are regularly performed on these test systems. We can’t perform leak checks on patients except while they are being tested however, and patient leaks are far more common than system leaks.

A technician asked me to look at a patient’s helium dilution FRC test because it had an odd helium tracing. The technician was sure the patient had been leaking but the FRC from this test was was actually the lowest of three tests and they weren’t sure why that was the case.

Once I saw it I was immediately able to tell the technician that it wasn’t a leak and that it was probably okay to report the results. I was able to say this because when there is a leak during a helium FRC test the helium constantly decreases and never plateaus. The rate of decrease may change but the most pertinent point is that the helium concentration never plateaus and even more importantly, it never increases.

Helium Tracing

I’ve seen this particular type of helium tracing before but to be sure I could properly explain what caused it I downloaded a table of system readings from the test software and they verified that what I thought happened was probably correct.

Continue reading

An IC shows it’s probably not restriction

For the last couple of years it seems that I’ve had more problems than usual with lung volume tests. Even though this seems to date from the time that my lab went through its hardware and software upgrade and we started performing N2 washouts I suspect that these problems have been around for a long time and these events just heightened my awareness of lung volume testing problems.

My lab performs helium dilution, N2 washout and plethysmographic lung volume tests. When you are assessing the quality of lung volume tests the first problem for the helium dilution and plethysmographic techniques is whether or not the Functional Residual Capacity (FRC) was accurately measured and for N2 washout, it’s whether or not the Residual Volume (RV) was accurately measured. Leaks are always an issue for any of these measurement techniques and for helium dilution and N2 washout leaks will almost always cause the Total Lung Capacity (TLC) to be overestimated. For plethysmography the picture is less clear since leaks can cause TLC to be either over- or under-estimated.

Once you accept that the initial measurement of FRC or RV is accurate, however, the next question is whether the SVC is accurate or not. Since SVC is a more relaxed test than a forced vital capacity the SVC volume should be at least the same as the FVC volume and it is often larger. When I see an SVC that is smaller than the FVC I tend to think that the calculated TLC is probably okay and it’s the RV that is more likely to be overestimated. This is because the Inspiratory Capacity (IC) part of the SVC maneuver (“take as deep breath in as you can!”) is the easiest part and when the SVC is low, it is usually because the Expiratory Reserve Volume (ERV, “blow everything out that you can!”) is underestimated.

This report came across my desk a couple of days ago. The lung volumes were performed by helium dilution.

Not_RVD_Results 

Continue reading

How should predicted TLC and RV be derived?

The ATS-ERS standards on lung volume measurements says that measured TLC and RV can be calculated either by

RV = FRC – ERV then TLC = RV + SVC

or by

TLC = FRC + IC then RV = TLC – SVC

with the preference going to the first method. Strictly speaking, given the same FRC and SVC measurements either method is going to end up with exactly the same calculated TLC and RV values. Conceptually speaking I believe that TLC = FRC + IC is a more relevant way to think about TLC but this is only because I think that patients find it easier to perform a quality IC maneuver than a quality ERV maneuver.

A while back I found out that the predicted TLC in my lab’s test systems was being derived from the predicted RV from one set of equations and the predicted FVC from another set of equations (i.e. predicted TLC = predicted RV + predicted FVC). This is likely done so that there will be no discrepancy between the predicted FVC and predicted SVC on reports. I am not sure this is the correct decision since SVC does tend to be slightly larger that FVC but the difference is admittedly small (<1%) in healthy subjects so it is not likely to be significant.

Does it matter, however, for predicted TLC and RV which value’s reference equation you start with and which FVC reference equation you use with them? 

There are, of course, many different reference equations for lung volumes and spirometry, but to keep this simple I will choose the ones that I think are the most common and most relevant. For a 50 year old, 175 cm Caucasian male therefore, the predicted lung volumes look like this:

Equation: TLC FRC RV SVC
Quanjer 6.90 3.42 2.16 4.74
Crapo 6.74 3.60 1.98 4.76

Continue reading

What’s wrong with this picture?

I had mentioned previously that my PFT Lab has been questioned why the percent predicted Residual Volume (RV) measurements on some research patients were coming out so much lower at my lab than at some other PFT Labs. At that time the researchers had not shared the results they had from these patients so we could only speculate that either our RV’s were actually lower or that the predicted RV values used by the other PFT Labs were different than ours. We finally got a copy of the PFT report for one of these patients and it turns out that both answers were correct.

First, the predicted RV from what I will call Lab X (I am not familiar with the lab nor with any of the physicians or technicians there) was 15% lower than ours. My lab is using the reference equations from Stocks et al which are recommended by the ERS. I was unable to determine which sets of reference equations Lab X was using. They weren’t listed on the report and the calculated values didn’t seem to match any of the reference equations I have on hand. Our lab software uses the predicted RV plus the predicted Forced Vital Capacity (FVC) (from NHANESIII) to calculate predicted Total Lung Capacity (TLC). It is possible that Lab X’s software calculates the predicted RV by subtracting their predicted FVC from a predicted TLC.

I am not, however, going to try to argue that my lab’s predicted values are better than those of Lab X, just that they are different. The ATS has not officially recommended any particular set of lung volume reference equations and I think it would be easy to argue that all current reference equations are flawed to one extent or another. I would like to know how they were derived at Lab X but that is just to satisfy my own curiosity. Using Lab X’s predicted RV, our measured RV was 179% of predicted where by our reference equations it was 152% of predicted. This explains part of the difference in percent predicted values but by no means all of it.

When I looked at the actual test results from Lab X however, I saw numerous errors in the lung volume test and test calculations.

Continue reading

FRC baseline shift affects TLC and RV

The plethysmographic technique for measuring lung volumes determines FRC first and then uses a slow vital capacity maneuver to calculate TLC and RV. FRC is defined as the volume of the lung at the end of a normal exhalation. The two components of the SVC maneuver that are used to calculate TLC and RV are the Inspiratory Capacity (IC) and the Expiratory Reserve Volume (ERV) and they too are measured relative to FRC. It would therefore seem to be important to have an accurate notion as to where FRC is in relation to TLC and RV when measuring lung volumes.

From ATS-ERS Standardisation of lung volume measurements, page 512

From ATS-ERS Standardisation of lung volume measurements, page 512

Plethysmography measures lung volumes by having a patient pant against a closed shutter and measuring pressure changes. The test is usually performed by having the patient breathe tidally for a period in order to determine where end-exhalation (FRC) is located, closing the shutter and performing the measurement, then returning to tidal breathing and performing the SVC maneuver. A critical assumption in this process is that the FRC baseline does not change while the shutter is closed.

Continue reading

What’s normal about RV and what does this have to do with TLC?

A physician associated with my PFT lab has become an investigator for a device study intended for patients with severe COPD. One of the major criteria for patients to be able to enroll in this study is a severely elevated Residual Volume (RV). Patients who have met this criteria at other PFT labs in New England have been referred to this study but when they have been re-tested in my lab their Residual Volumes are coming out lower and almost none of these patient have met this criteria. We have been asked why this is the case because they are now having difficulty finding patients that qualify for the study.

We have not been given access to the original PFT reports for these patients and have not been able to actually compare results on a case by case basis. For this reason we can only offer two possible reasons. First, that my lab may not be using the same reference equations for RV that other labs are. Second, that these patient’s RV’s may have been overestimated at other labs because of errors in testing.

To compare predicted RV’s I was able to find a dozen different reference equations for RV in adult males and females. These equations are mostly for Caucasian populations, but I was also able to find at least one reference equation each for Black, Asian, Indian, Iranian and Brazilian populations as well.

Continue reading

The ERV Effect

I used to think that spirometry and diffusion capacity tests were hard and that lung volumes were easy. That may have been true in terms of getting patients to do the tests but I’ve long since come to the conclusion that it is easier to assess the quality of spirometry and diffusing capacity tests and know whether you have reasonably accurate results than it is to do this for lung volumes regardless of which lung volume measurement technique you use.

I was reviewing a set of plethysmographic lung volume tests when I noticed something very odd about the reported results. I usually look at just the VTG loops and the volume-time graphs in order to assess test quality. The testing software automatically selects and averages all VTG efforts and when I reviewed them there were a couple loops that were poor quality and I manually de-selected them. I was reviewing this report because the reported lung volume results didn’t quite match what the spirometry results were saying so this time I also took a close look at the numbers after I removed the low-quality loops. That’s when I realized that the reported TLC was larger than the two tests it was averaged from.

Pleth Math

Continue reading

VA versus TLC, what this can tell you about test quality

I’ve had a bug lately about lung volumes and I guess that today is no different. A report with some odd lung volume results came across my desk and I’ve spent some time trying to figure out what the numbers are telling me about test quality.

 VA vs TLC Table

What concerned me was the 15% discrepancy between the VA from the DLCO and the TLC measured by plethysmography. VA is measured from the insoluble component of the DLCO gas mixture (methane in this case) and is almost always less than TLC. VA is a single-breath measurement and for VA and TLC to be close this usually means the patient must have very good gas mixing inside their lungs. Even when the quality of the DLCO and lung volume tests are good however, VA is almost always less than TLC. So why was VA so much larger than TLC in this case?

Continue reading