The importance of an earnest SVC

A report came across my desk today and at first glance it looked fairly straightforward. There was a mildly reduced TLC and FVC, and although the SVC was slightly lower than the FVC it looked like this patient had mild restriction.

Observed: %Predicted: Predicted:
FVC: 1.73 68% 2.56
FEV1: 1.23 65% 1.89
FEV1/FVC: 71 97% 73
TLC: 3.58 73% 4.89
FRC: 2.07 75% 2.78
RV: 1.94 83% 2.33
RV/TLC: 54 114% 48
SVC: 1.69 66% 2.56
IC: 1.51 72% 2.11
ERV: 0.13 30% 0.45

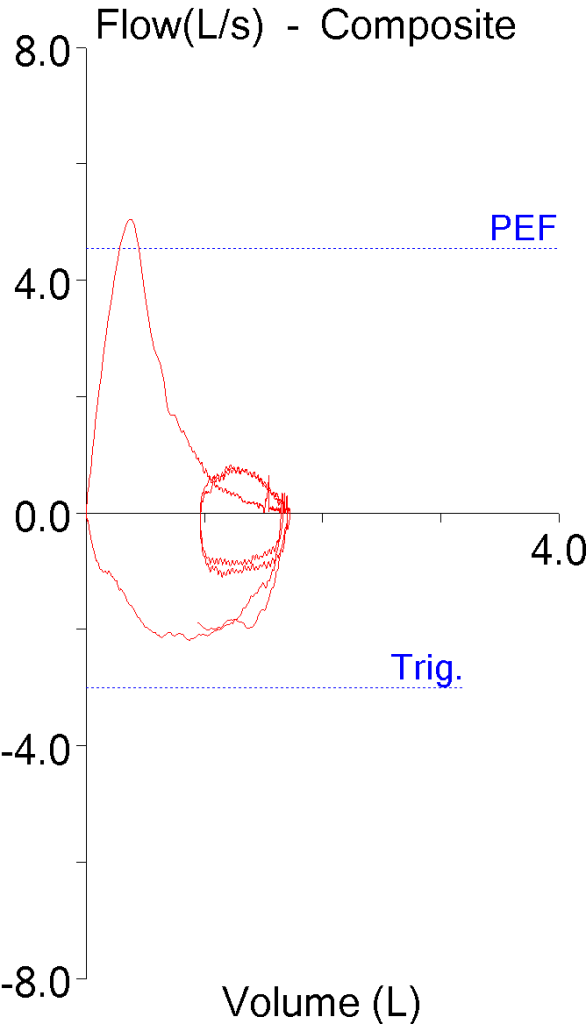
In addition, the flow-volume loop looked fairly typical for restriction, with a normal peak flow and a reduced volume.

SVC_TLC_Under_FVL_redacted

When I looked at the DLCO results however, I suddenly got a different picture. Specifically, the VA from the DLCO was larger than the TLC and the inspired volume (Vinsp) was significantly larger than both the FVC and the SVC.

Observed: %Predicted: Predicted:
DLCO: 13.51 83% 16.23
VA: 3.87 82% 4.73
Vinsp: 2.26

Continue reading

RVD’s and OVD’s can’t mix without the FEV1/FVC ratio

The patients whose reports I review have always been very accommodating. An issue of one kind or another catches my attention and before I know it I find several more reports that are similarly involved. Thanks to our patients I’ve had a number of reports come across my desk recently that showed a combination of restrictive and obstructive defects. This particular one may not be the best possible example but it seems to illustrate several points fairly well.

Observed: %Predicted: Predicted:
FVC (L): 1.12 40% 2.80
FEV1 (L): 0.75 35% 2.16
FEV1/FVC (%): 67 86% 78
TLC (L): 1.92 42% 4.54
FRC (L): 1.18 48% 2.47
RV (L): 0.76 44% 1.73
RV/TLC (%): 40 104% 38

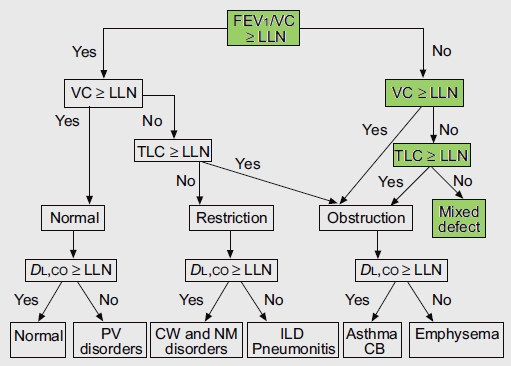
Interpreting results like this as combined (or mixed) defects using the ATS/ERS algorithm seems relatively straightforward.

ATS-ERS Algorithm 2

From Brusasco V, Crapo R, Viegi G. ATS/ERS Task Force: Standardisation of pulmonary function testing. Interpretive strategies for lung function tests. Eur Respir J 2005; 26, page 956

The algorithm starts by using the FEV1/FVC ratio to determine whether obstruction is present and only then considers whether or not the FVC and TLC are normal. It occurred to me however, that this assumes that the normal range of the FEV1/FVC ratio is preserved when TLC decreases below normal. Given the markedly different causes of restrictive lung disease it would seem that saying that the FEV1/FVC ratio should remain within the normal range over a relatively broad range of lung capacities (and without necessarily knowing the cause for any reduction) seems a bit far-fetched. Interestingly enough however, it actually turns out to be reasonably true.

Continue reading

Helium overshoot, revisited

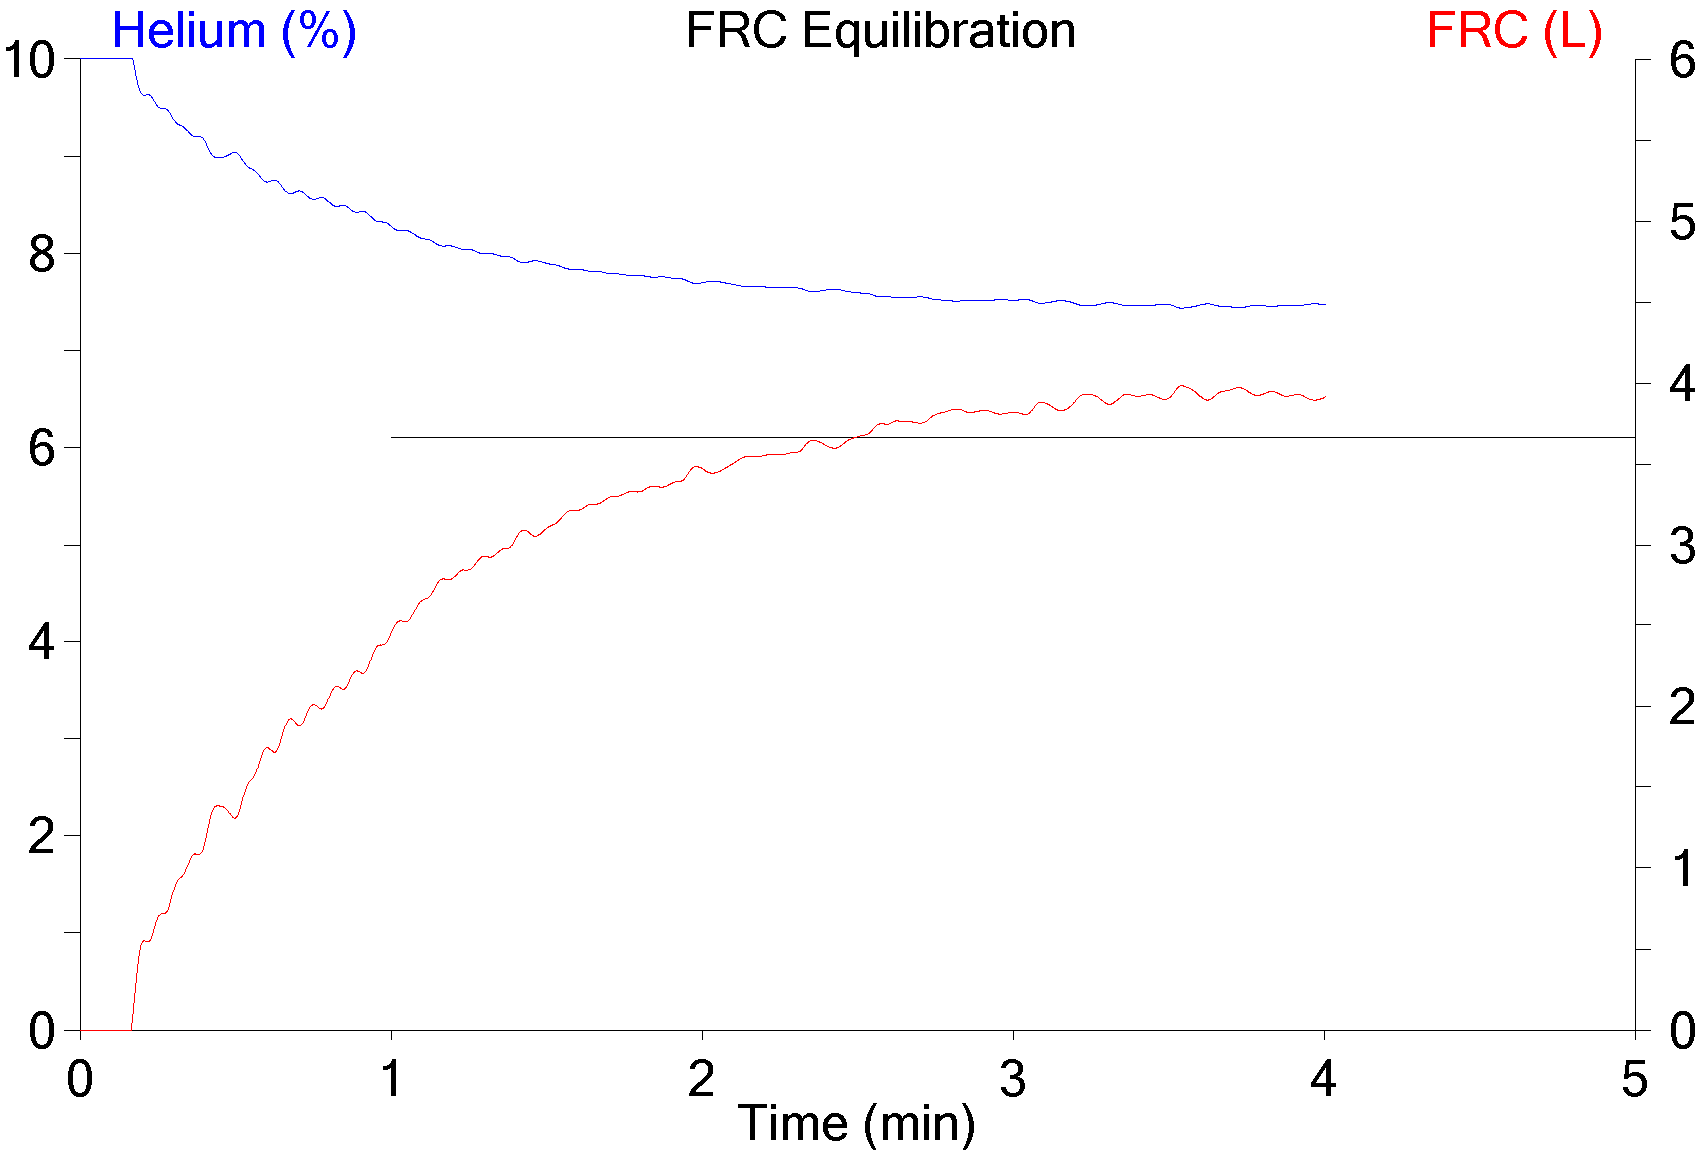
A while back one of our technicians brought a helium dilution FRC graph to my attention and wanted to know if it showed a system leak. At that time my response was that it definitely wasn’t a leak (leaks don’t show increases in helium) and was probably due to too much oxygen being added to the system at the beginning of the test.

Helium_Overshoot_01

A couple of days ago a technician brought a similar graph to me and again I was asked why it looked unusual. I’ve had time to think about this issue since the last time and I’ve come up with an alternate explanation that I think fits the facts a bit better.

A normal helium dilution curve looks something like this:

Helium_Overshoot_02_nl-ish

which shows the helium decreasing with what is more or less an exponential decay curve. What’s unusual about the other curve is that it shows a relatively rapid fall to the lowest helium concentration near the beginning of the test and then a slow rise to the final concentration.

Continue reading

A real fixer-upper

I was reviewing reports today when I ran across one with some glaring errors. There were several things that immediately told me that the reported plethysmographic lung volumes were way off; the VA from the DLCO was almost a liter and a half larger than the TLC and the SVC was only about half the volume of the FVC.

Table1

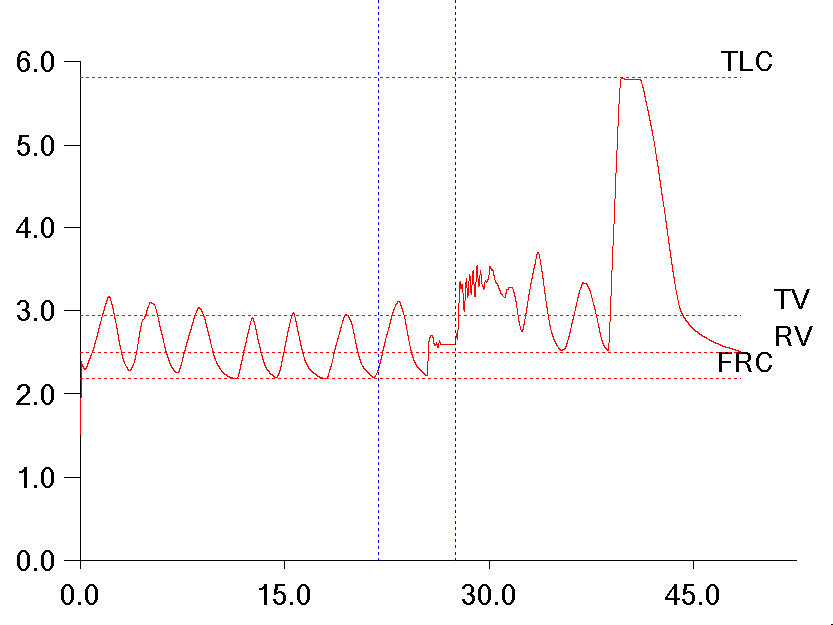
When I took a look at the raw test data I saw at least part of the reason why the technician had selected these results to be reported and that was because the SVC quality from most of the efforts was poor. They mostly looked like this:

Fixer_Upper_01

It is apparent that the patient leaked while panting against the closed shutter and this caused the FRC baseline to shift upwards. I’ve discussed this problem previously, but when this happens the RV is larger than the FRC, there is a negative ERV and the TLC is overestimated. There is no way to fix this problem from within the software. The FRC is determined by the tidal breathing before the shutter closes and cannot be re-measured afterward.

Continue reading

Have you checked the math on your reports lately?

Once again my lab was questioned by a research study’s primary investigator and study coordinator about why our lung volume results came out significantly lower than another lab’s. In order to be part of this study a subject has to have an RV that is greater than 150% of predicted. The RV we had obtained on a subject referred to the study was over a liter less than the results they had brought with them from another lab and for this reason the patient no longer qualified.

When I reviewed the subject’s test data from my lab it was clear to me that our test quality was good and more than met the ATS/ERS reproducibility criteria. We were given a copy of the subject’s report from the other lab and at first glance, the results look very typical for emphysema. Specifically the report showed very severe airway obstruction, a normal TLC, an elevated FRC and RV consistent with hyperinflation and a severely reduced DLCO. Our results however, showed a mixed defect with severe obstruction and a mildly reduced TLC.

Getting accurate lung volume measurements is hard. Regardless of which measurement technique you use, in most instances any errors tend to cause lung volumes to be overestimated. When very severe airway obstruction is present unless you are careful about panting frequency, plethysmography will often overestimate FRC and TLC, and that may be what happened in this case.

But this isn’t about test quality or the reasons why I believe my lab is better than most others. Although the report was from a nearby hospital with a reputation for the quality of its patient care, when I started reviewing it I immediately started to see math errors among the predicted values. I’ve run across these kind of errors before but this report was from a different equipment manufacturer than last time and this means that these kind of errors are probably far more common than I ever would have expected.

Continue reading

The VA/TLC ratio

I was reading James Hansen’s textbook on pulmonary function testing (one of my more interesting reads lately) and in passing he mentioned using the VA/TLC ratio as a way to measure ventilation inhomogeneity. The VA/TLC ratio has also been called the Va,eff/VA ratio and the VA’/VA ratio by different researchers but regardless of what it is called it is the ratio between a single-breath TLC measurement (VA) taken from a DLCO test and a multi-breath (helium dilution or N2 washout) or plethysmographic TLC.

A single-breath TLC regardless of whether helium, nitrogen, methane or argon is used tends to underestimate TLC even in individuals with normal lungs (and if the ratio > 1.0 then there is likely a technical problem with either the lung volume or DLCO measurements). This is mostly because of the limited time a single breath of tracer gas has to mix and diffuse evenly throughout the lungs. The idea is that a low VA/TLC ratio indicates poor gas mixing and therefore an elevated ventilation inhomogeneity.

The VA/TLC ratio is a relatively simple approach towards measuring ventilation inhomogeneity largely because the results can be derived from regular TLC and DLCO measurements. It was first proposed as a measurement over 40 years ago but despite having several notable proponents it has not achieved any particular level of acceptance.

Part of the reason for this may be that there is limited agreement about what a constitutes a normal VA/TLC ratio. Cotes et al suggest that the ratio decreases slightly with age and stated that the normal range is 0.9 to 1.0 at age 20 and 0.85 to 0.95 at age 60. Roberts et al, however, in a study with a reasonably large population (n=379) selected for the presence or absence of certain conditions (normal, asthma, COPD) found no particular correlation with age (or height, weight and gender) and stated that in individuals with normal FEV1/FVC ratios the LLN was 0.828. Punjabi et al in a retrospective study of 5369 individuals unselected except for the presence of acceptable test quality stated that for FEV1/FVC ratios above 0.70 the VA/TLC ratio was 0.98.

There is general agreement however, that the strongest correlation between TLC and VA is an individual’s FEV1/FVC ratio.
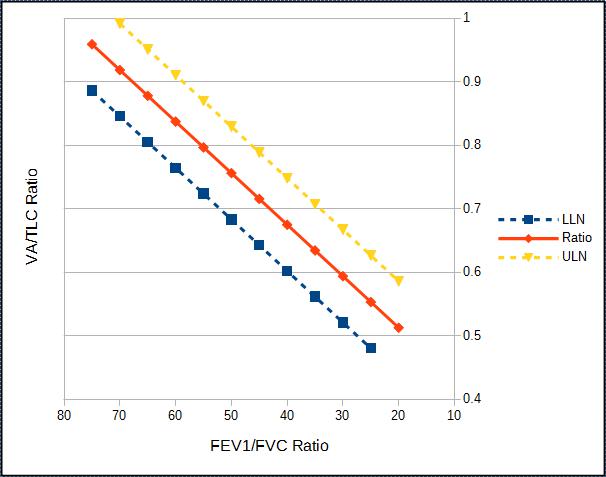
VA/TLC ratios from Burns et al.

The correlation between VA/TLC ratio and the FEV1/FVC ratio from Burns et al.

VA_TLC_Ratio_Formula_Burns

Continue reading

The effects of Obesity on lung function

Obesity has become far more commonplace than it was a generation ago. The reasons for this are unclear and have been attributed at one time or another to hormone-mimicking chemicals in our environment, altered gut biomes, sedentary lifestyles or the easy availability of high calorie foods. Whatever the cause, obesity affects lung function through a variety of mechanisms although not always in a predictable manner.

Spirometry:

Many investigators have shown a relatively linear relationship between an increase in BMI and decreases in FVC and FEV1. These decreases are small however, and FVC and FEV1 tend to remain within normal limits even in extreme obesity. The decreases in FEV1 and FVC tend to be symmetrical which is shown by the fact that the FEV1/FVC ratio is usually preserved in obese subjects without lung disease. Several studies have shown that the decreases in FVC and FEV1 are reversible since a decrease in weight showed a corresponding increase in FVC and FEV1.

In one study a 1 kg increase in weight correlated with a decrease in FEV1 of approximately 13 ml in males and 5 ml in females. The same increase in weight correlated with a decrease in FVC of approximately 21 ml in males and 6.5 ml in females. The greater change in FVC and FEV1 in males than females has been attributed to the fact that males tend to accumulate extra weight primarily in the abdomen.

The notion that abdominal weight has a disproportionate effect on lung function is seconded to some extent by studies that have shown that decreases in FVC and FEV1 correlated better with increases in waist circumference and the waist to hip ratio than with BMI. One study showed a 1 cm increase in waist circumference caused a 13 ml reduction in FVC and an 11 ml reduction in FEV1 across a range of elevated BMI’s.

Continue reading

When TLC, RV and VC don’t add up

I thought I was done with lung volume issues for at least a little while but a short time ago I was reviewing a report from another PFT lab and I ran across something that didn’t seem to make sense. What the report showed was a normal TLC (99% of predicted) with a normal VC (101% of predicted) but the RV was 70% of predicted.

When I took a closer look, it was evident that the predicted VC came from the NHANESIII study and the predicted TLC and RV came from the ERS 1993 Statement. In my PFT lab our equipment manufacturer made the decision to use the predicted RV from whatever source the end-user selected (which in our case is the ERS93 study as well) but to re-calculate the predicted TLC using the predicted FVC, again from whatever source the end-user selected (which in our case was also NHANESIII). What this means is that for my lab:

predicted TLC = predicted VC + predicted RV.

What I saw in the report however, was that the predicted TLC and RV came from the ERS93 study and the predicted VC came from NHANESIII but that meant that:

predicted TLC ≠ predicted VC + predicted RV.

In fact the predicted TLC was almost a half a liter less than if it had been calculated from the predicted RV and predicted VC. What I also saw was that:

predicted TLC ≠ predicted FRC + predicted IC

predicted RV ≠ predicted FRC – predicted ERV

Continue reading

Substituting an FVC for an SVC in Lung Volume measurements

Recently I was reviewing test results from another PFT Lab that uses equipment from a different manufacturer than what my lab uses. When I came to the lung volumes it became evident that the FVC had been substituted for the SVC. I understand the point of using the largest vital capacity when calculating TLC and RV but there are some issues affecting these values when this is done.

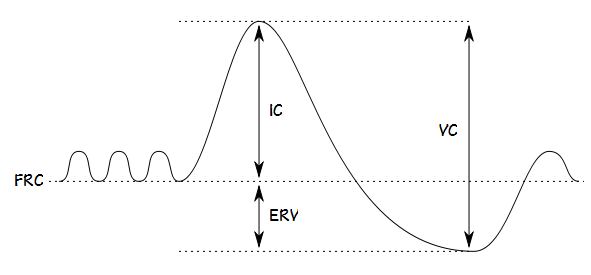
Strictly speaking using the FVC is permitted by the ATS/ERS guidelines on lung volume testing, but how an FVC is to be used, as opposed to an SVC, is not addressed. The reason this is an issue is that all lung volume tests regardless of which method is used do not measure TLC and RV directly, they measure FRC. The preferred ATS/ERS TLC calculation is then:

RV = FRC – ERV and TLC = RV + VC

But

TLC = FRC + IC and RV = TLC – VC

is also permitted.

IC and ERV are not explicitly measured from an FVC maneuver and are instead measured during an SVC measurement.

FRC IC ERV VC

Continue reading

When is it hyperinflation?

I was reviewing a PFT recently and noticed that the FEV1 was severely reduced and that the FRC and RV were both elevated. This is a pattern we associate with obstructive gas trapping but I’ve also been reviewing textbooks on pulmonary function interpretation and have found that there isn’t any kind of a universal definition for this.

Hyperinflation and gas trapping are used somewhat interchangeably but the distinction is that gas trapping causes hyperinflation. Gas trapping occurs to some extent in everybody but usually at lung volumes below FRC. The lung volume at which gas trapping occurs rises with age and with obstructive lung disease. Hyperinflation is usually considered to be an increase in FRC but FRC is a dynamic lung volume and there is a range in the response to increased gas trapping. The normal progression from mild to very severe COPD goes something like this:

FEV1: FVC: FRC: RV: TLC: RV/TLC:
Mild
Moderate ↓↓
Severe ↓↓↓ ↓↓ ↑↑ ↑↑
Very Severe ↓↓↓↓ ↓↓↓ ↑↑ ↑↑↑ ↑↑↑

Gas trapping and hyperinflation have significant consequences for an individual’s exercise capacity and level of dyspnea. It is an important clinical finding but from a PFT point of view when is it clearly present?

Continue reading