When flow-volume loops get kinky

One of the more recognizable flow-volume loop contours is the one associated with severe airway obstruction. Specifically, this type of loop shows an abrupt decrease in flow rate following the peak flow with a more gradual decrease in flow rates during the remainder of the exhalation.

V_Sev_OVD_03_Cropped

This abrupt decrease in flow rates was first described on a volume-time curve and the inflection point was called a “kink” but this point also corresponds with the inflection point on the flow-volume loop. This feature has also been called a “notch” or a “spike” but a number of researchers have called this the Airway Collapse pattern (AC) and it is more formally defined as a sharp decrease in flow rate from peak flow to a discontinuity point at less than 50% of the peak flow and occurring within the first 25% of the exhaled vital capacity.

Continue reading

What’s a normal Flow-volume Loop?

Dozens of articles have been written about the correlation between different abnormal flow-volume loop contours and pulmonary disorders. In contrast very little has ever been written about what constitutes a normal flow-volume loop and what this looks like has been primarily anecdotal.

Interestingly, the ATS/ERS standard for spirometry includes an example of a “normal” flow-volume loop but its source and what makes it normal is not explained.

ATS_ERS_Normal_FVL

From the ATS/ERS standard on spirometry, page 327.

One feature that is commonly seen as a feature of normal flow-volume loops has been variously called a ‘shoulder’ or ‘knee’.

Normal_FVL_Shoulder

Continue reading

A change that probably isn’t a change

Recently a report came across my desk from a patient being seen in the Tracheomalacia Clinic. The clinic is jointly operated by Cardio-Thoracic Surgery and Interventional Pulmonology and among other things they stent airways. The patient had been stented several months ago and this was a follow-up visit. Given this I expected to see an improvement in spirometry, which had happened (not a given, BTW, some people’s airways do not tolerate stenting), but what I didn’t expect to see was a significant improvement in lung volumes and DLCO.

When I took a close look at the results however, it wasn’t clear to me that there really had been a change. Here’s the results from several months ago:

Observed: %Predicted: Predicted:
FVC: 1.19 50% 2.38
FEV1: 0.64 35% 1.79
FEV1/FVC: 53 71% 76
TLC: 3.21 76% 4.22
FRC: 2.34 96% 2.43
RV: 2.11 113% 1.85
RV/TLC: 66 150% 44
SVC: 1.15 48% 2.37
IC: 0.87 48% 1.80
ERV: 0.25 41% 0.58
DLCO: 6.59 38% 16.18
VA: 1.78 43% 4.12
IVC: 1.04

Change_that_isnt_change_2015_FVL_redacted_2

[more] Continue reading

COPD and the FEV1/FVC ratio. GOLD or LLN?

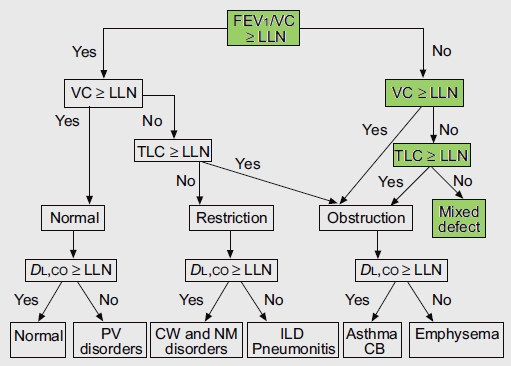
Everyone uses the FEV1/FVC ratio as the primary factor in determining the presence or absence of airway obstruction but there are differences of opinion about what value of FEV1/FVC should be used for this purpose. Currently there are two main schools of thought; those that advocate the use the GOLD fixed 70% ratio and those that instead advocate the use the lower limit of normal (LLN) for the FEV1/FVC ratio.

The Global Initiative for Chronic Obstructive Lung Disease (GOLD) has stated that a post-bronchodilator FEV1/FVC ratio less than 70% should be used to indicate the presence of airway obstruction and this is applied to individuals of all ages, genders, heights and ethnicities. The official GOLD protocol was first released in the early 2000’s and was initially (although not currently) seconded by both the ATS and ERS. The choice of 70% is partly happenstance since it was one of two fixed FEV1/FVC ratio thresholds in common use at the time (the other was 75%) and partly arbitrary (after all why not 69% or 71% or ??).

The limitations of using a fixed 70% ratio were recognized relatively early. In particular it has long been noted that the FEV1/FVC ratio declines normally with increasing age and is also inversely proportional to height. For these reasons the 70% threshold tends to over-diagnose COPD in the tall and elderly and under-diagnose airway obstruction in the short and young. Opponents of the GOLD protocol say that the age-adjusted (and sometimes height-adjusted) LLN for the FEV1/FVC ratio overcomes these obstacles.

Proponents of the GOLD protocol acknowledge the limitation of the 70% ratio when it is applied to individuals of different ages but state that the use of a simple ratio that is easy to remember means that more individuals are assessed for COPD than would be otherwise. They point to other physiological threshold values (such as for blood pressure or blood sugar levels) that are also understood to have limitations, yet remain in widespread use. They also state that it makes it easier to compare results and prevalence statistics from different studies. In addition at least two studies have shown that there is a higher mortality of all individuals with an FEV1/FVC ratio below 70% regardless of whether or not they were below the FEV1/FVC LLN. Another study noted that in a large study population individuals with an FEV1/FVC ratio below 70% but above the LLN had a greater degree of emphysema and more gas trapping (as measured by CT scan), and more follow-up exacerbations than those below the LLN but above the 70% threshold.

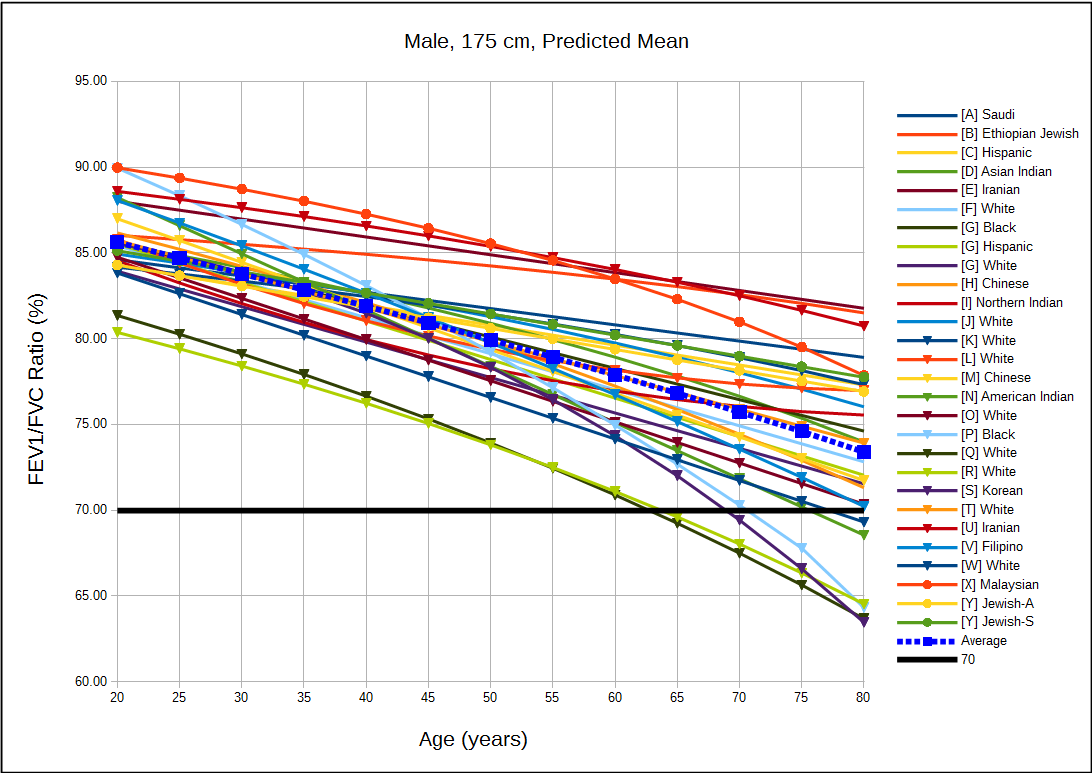
Since many of the LLN versus GOLD arguments are based on statistics it would be useful to look at the predicted FEV1/FVC ratios in order to get a sense of how much under- and over-estimation occurs with the 70% ratio. For this reason I graphed the predicted FEV1/FVC ratio from 54 different reference equations for both genders and a variety of ethnicities. Since a number of PFT textbooks have stated that the FEV1/FVC ratio is relatively well preserved across different populations what I initially expected to see was a clustering of the predicted values. What I saw instead was an exceptionally broad spread of values.

Male_175cm_Predicted

[more] Continue reading

LLN versus 80%

Recently a rather eminent reader commented on an older blog entry. He finished his comment with a paragraph on another topic, however. Specifically:

By the way, it is also high time that we scuttle the habit of expressing a measurement as percent of predicted. As Sobol wrote [5]: “It implies that all functions in pulmonary physiology have a variance around the predicted, which is a fixed per cent of predicted. Nowhere else in medicine is such a naive view taken of the limit of normal.”

I understand the point and have been thinking about this off and on since the comment was posted but I keep coming back to the same response, and that is “yes, but…”.

First the “yes” part.

Other than the fact that any percent of predicted cutoff is an arbitrary line in the sand (80% of predicted is most commonly used as the cutoff for normalacy but why not 75%? why not 85%?) the biggest argument against the use of percent predicted is the way in which normal values tend to be distributed. When FVC or TLC is studied within a reasonably large group of “normal” individuals the results are usually distributed fairly evenly above and below the mean. This is referred to as a homoscedastic distribution.

Homoscedastic_Distribution

For this reason when, for example, +/- 20% is used as the normal range this tends to exclude some normal individuals with lower volumes and heights and includes some individuals with larger volumes and heights that are probably not normal.

Homoscedastic_versus_20pct

Continue reading

Graphical Analysis of Flow-Volume Loops

I’ve been thinking a bit about the shape of flow-volume loops lately. In part this has been about ways to accurately describe them in reports; in part speculation about the information that may be embedded in them that isn’t in any of the routinely reported spirometry values; and in part about how the human eye perceives and categorizes them in a way that is difficult to simplify and put into a computer algorithm. A couple days ago I found a recent article where a geometrical analysis was applied to flow-volume loops in individuals with COPD and this got me curious about what other graphical techniques have been used to analyze flow-volume loops.

Given how long flow-volume loops have been around (over 50 years) the graphical analysis of flow-volume loops has been attempted remarkably few times. Excluding a handful of strictly numerical approaches (based primarily on MEF and MIF ratios) I was only able to find three graphical analysis techniques. I think this small number says volumes about the difficulty of analyzing flow-volume loop shapes meaningfully. Despite different degrees of sophistication the reality is that none of these techniques has ever seen any kind of common usage. Even so these attempts are both interesting and instructive.

The most recent technique is a fairly straightforward geometric approach from Lee et al and its use appears to be limited primarily to individuals with airway obstruction.

FVL_Geometric_1

The flow-volume loop is analyzed primarily to determine what the authors call the Area of Obstruction (Ao). To do this, a diagonal line is drawn from peak flow to the end of exhalation. The area that exists between the actual flow-volume loop contour and this diagonal line is defined as the area under the diagonal (Au). The area of Au is then compared to the area of a triangle (At) defined by the peak flow, the exhaled volume at the time of the peak flow, and the end of exhalation. The area of obstruction, which is actually a ratio, is then calculated as:

Continue reading

The importance of an earnest SVC

A report came across my desk today and at first glance it looked fairly straightforward. There was a mildly reduced TLC and FVC, and although the SVC was slightly lower than the FVC it looked like this patient had mild restriction.

Observed: %Predicted: Predicted:
FVC: 1.73 68% 2.56
FEV1: 1.23 65% 1.89
FEV1/FVC: 71 97% 73
TLC: 3.58 73% 4.89
FRC: 2.07 75% 2.78
RV: 1.94 83% 2.33
RV/TLC: 54 114% 48
SVC: 1.69 66% 2.56
IC: 1.51 72% 2.11
ERV: 0.13 30% 0.45

In addition, the flow-volume loop looked fairly typical for restriction, with a normal peak flow and a reduced volume.

SVC_TLC_Under_FVL_redacted

When I looked at the DLCO results however, I suddenly got a different picture. Specifically, the VA from the DLCO was larger than the TLC and the inspired volume (Vinsp) was significantly larger than both the FVC and the SVC.

Observed: %Predicted: Predicted:
DLCO: 13.51 83% 16.23
VA: 3.87 82% 4.73
Vinsp: 2.26

Continue reading

6MWT re-visited, now with the MCID!

I often find topics for this blog in a sideways fashion. Recently while searching for something else I ran across an article about the minimum clinically important difference (MCID) of the Residual Volume (RV) in patients with emphysema. I’ve come across the MCID concept before but I had never really followed up on it. This time I started researching MCID and immediately ran across a number of articles about the MCID of the 6-minute walk test (6MWT). This got me to review the articles I have on hand and I found that since I last wrote about the 6MWT I’ve accumulated quite a few new (or at least new to me) reference equations as well as a number of articles about performance issues. Given all this how could I not re-visit the 6MWT?

In addition to the 6 reference equations I had previously I’ve found another 13 female and 14 male reference equations for the 6MWT (total 19 female, 20 male) which is an opportunity to re-visit the selection process. This immediately raises the question about what factors should be used to calculate the predicted 6-minute walk distance (6MWD). Because the 6MWT is essentially an exercise test age has an obvious effect on exercise capacity so it is no surprise that with the exception of one set all of the reference equations consider age to be a factor. It should be noted however, that many of the reference equations are intended to be only applied over a limited range of ages and this may limit their utility.

Given the fact that stride length and therefore walking speed are directly related to height it is somewhat surprising to find that only twelve of the male and eleven of the female reference equations consider height to be a factor. When height is a factor, the predicted 6MWD is usually affected something like this:

Height_6MWD

Weight also affects exercise capacity but an interesting question is whether the observed 6MWD should be compared to a predicted 6MWD based on a “normal” weight or whether the 6MWD should be adjusted to the individual’s actual weight and assessed accordingly. To some extent this is already an issue in current PFT predicted equations. For example, weight is not a factor in any of the FVC or TLC reference equations and when lung volumes are decreased in the presence of obesity they are considered to be abnormal. On the other hand, the reference equations I use for maximum oxygen consumption during a CPET include weight as a factor and for a number of reasons this is likely the correct approach. For this last reason I would think that weight should be a factor and ten of the reference equation sets consider weight (or BMI) to be a factor. When weight is a factor, the predicted 6MWD is usually affected like this:

Weight_6MWD

Continue reading

RVD’s and OVD’s can’t mix without the FEV1/FVC ratio

The patients whose reports I review have always been very accommodating. An issue of one kind or another catches my attention and before I know it I find several more reports that are similarly involved. Thanks to our patients I’ve had a number of reports come across my desk recently that showed a combination of restrictive and obstructive defects. This particular one may not be the best possible example but it seems to illustrate several points fairly well.

Observed: %Predicted: Predicted:
FVC (L): 1.12 40% 2.80
FEV1 (L): 0.75 35% 2.16
FEV1/FVC (%): 67 86% 78
TLC (L): 1.92 42% 4.54
FRC (L): 1.18 48% 2.47
RV (L): 0.76 44% 1.73
RV/TLC (%): 40 104% 38

Interpreting results like this as combined (or mixed) defects using the ATS/ERS algorithm seems relatively straightforward.

ATS-ERS Algorithm 2

From Brusasco V, Crapo R, Viegi G. ATS/ERS Task Force: Standardisation of pulmonary function testing. Interpretive strategies for lung function tests. Eur Respir J 2005; 26, page 956

The algorithm starts by using the FEV1/FVC ratio to determine whether obstruction is present and only then considers whether or not the FVC and TLC are normal. It occurred to me however, that this assumes that the normal range of the FEV1/FVC ratio is preserved when TLC decreases below normal. Given the markedly different causes of restrictive lung disease it would seem that saying that the FEV1/FVC ratio should remain within the normal range over a relatively broad range of lung capacities (and without necessarily knowing the cause for any reduction) seems a bit far-fetched. Interestingly enough however, it actually turns out to be reasonably true.

Continue reading

The clue was in the O2

One of the overlooked parts of teaching pulmonary function interpretation is developing an appreciation for the number and variety of errors that the equipment, patients and technicians can produce and how they affect the reported test results. I routinely run across a couple dozen errors each week while reviewing reports. Most are minor and do not significantly affect the reported results. Many are mundane because they appear so often and a few are interesting because they point out a particular limitation in the equipment, software or testing standards. I’ve kept a file of the more iconic examples of testing errors for years and a while ago a pulmonary staff physician and I used to hold weekly sessions for fellows and residents where we’d present a number of “zingers” to see if they could figure them out. Unfortunately that physician has moved on to a different institution and I’m no longer as available as I used to be so these sessions are no longer held but I think that they or something like them should be held in all teaching hospitals.

These spirometry results came from a middle-aged woman with sarcoidosis.

Observed: %Predicted: Predicted:
FVC: 3.55 155% 2.29
FEV1: 1.06 60% 1.77
FEV1/FVC Ratio: 30 39% 77

Elevated FVC’s are not all that uncommon (and are a good example of the limitations of reference equations), but one that is 155% of predicted is particularly unusual. This occurs most commonly when somebody has made an error in measuring or entering the patient’s height (I can’t tell you the number of times I’ve seem someone entering 60 inches when they meant 6 feet), but this patient has been seeing pulmonary physicians and having regular spirometry tests for over a decade and the height for this test was the same as it was for the previous visit. In addition the trend report showed that over the last year the patient’s FVC had been between 71% and 65% of predicted.

Transtracheal_O2_FVL

The flow-volume loop doesn’t look overly unusual although the expiratory flow doesn’t taper off to zero and the patient maintained a low expiratory flow for at least two-thirds of the vital capacity.
Continue reading