Goiter, upper airway obstruction and the flow-volume loop

The thyroid gland is located across the front of the upper airway a short distance below the larynx. An enlarged thyroid gland is known as a goiter. The most common worldwide cause of goiter is an iodine deficiency. This is much less common in the western nations where factors such as Hashimoto’s thyroiditis, Graves’ disease, multi-nodular thyroid disease, thyroid cancer, pregnancy and the side effects of some medications are the its primary causes. Common respiratory complaints associated with goiter include cough, hoarseness, shortness of breath and stridor.

thyroid-gland

[illustration from HealthyThyro.com]

When a goiter is large enough it can press against the trachea and cause a narrowing or deviation of the upper airway. My lab usually gets at least a couple of patients referred to us every year with a diagnosis of goiter and a request that we assess whether it is causing any significant airway obstruction. Decades ago I was taught by my medical director that when this occurs it shows up as an expiratory plateau on a flow-volume loop.

FVL_Expiratory_Plateau

The reality (as usual) is more complex and this is mostly because the thyroid gland lies close to the boundary between the extrathoracic and intrathoracic sections of the trachea. Depending on its size and the which direction the thyroid expands towards, goiter can show up as an extrathoracic or intrathoracic airway obstruction. Even more importantly, as a recent article in Chest showed, the airway obstruction from goiter can be dependent on body position as well.

Continue reading

The 8 Percent Solution

The current ATS/ERS standards for a positive bronchodilator response are an increase in FEV1 or FVC of ≥ 12% and ≥ 200 ml. These standards are largely based on the ability to detect a change that is far enough above the normal variability in FEV1 and FVC to be considered significant. One problem with this is that the amount of variability that is considered to be “normal” is overly influenced by a relatively small number of subjects that have a high degree of variability.

At least one group of investigators has suggested that a way around this is to subject all of an individual’s pre- and post-bronchodilator spirometry to statistical analysis in order to determine their coefficient of variability. Once this is known, the pre- and post-bronchodilator efforts can be assessed as a group to determine whether whether there has been a statistically significant change. Using this approach they were able to show that a rather large number of subjects that did not meet the ATS/ERS criteria did have a statistically significant improvement in FEV1.

But an increase that is statistically significant or one that is greater than normal variability is not the same thing as clinical significance. Numerous investigators have noted that patient can have a post-bronchodilator clinical improvement as shown by a decrease in dyspnea or an increase in exercise capacity without any notable change in FEV1 or FVC. Clinical significance is hard to measure however, particularly since which criteria should be used to measure it are unclear.

Long-term survival is certainly clinically significant and a recent article in Chest (Ward et al) has linked the increase in post-bronchodilator FEV1 to this fact. What these investigators have been able to show was that individuals with a post-bronchodilator increase in FEV1 that was 8% of predicted or greater showed a significantly better long-term survival than individuals with a smaller increase.

Continue reading

Post-BD FVC. It’s about time.

When assessing the response to bronchodilators the change in FEV1 is used far more frequently than any other spirometry result. Other values such as inspiratory capacity (IC) and peak inspiratory flow (PIF) have also been proposed as indicators, but the ATS/ERS standards includes changes in FVC as well as changes in FEV1 and this is often overlooked. Specifically they:

…recommend using the per cent change from baseline and absolute changes in FEV1 and/or FVC in an individual subject to identify a positive bronchodilator response. Values >12% and 200 mL compared with baseline during a single testing session suggest a ‘‘significant’’ bronchodilatation.”

I don’t have any particular disagreement with this since post-BD increases in FVC are probably similar in nature to the post-BD changes in IC seen in some individuals with COPD. So when spirometry results like this:

Pre-BD: %Predicted: Post-BD: %Change:
FVC: 1.82 66% 2.55 +40%
FEV1: 0.66 32% 0.72 +10%
FEV1/FVC: 37 49% 29 -22%

comes across my desk, I’m inclined to consider that the results show a positive bronchodilator response. Post-BD increases in FVC are not usually quite as large as 40% however, so I took a closer look at this particular test. When I did what I saw was that the post-BD test length was significantly longer than the pre-BD test length.

Longer_FVC

Continue reading

Adjusting DLCO for hemoglobin

My hospital’s Oncology division treats a number of patients with lymphoma and leukemia. It also has an active bone-marrow transplant program and for all of these patients diffusing capacity measurements are a critical part of assessing treatment progress. Since these patients are also frequently anemic, correcting DLCO results for hemoglobin is also critical.

For a factor that has as much importance for the interpretation of DLCO results as it does the effect of hemoglobin on DLCO has actually been studied a relatively small number of times. Part of the reason for this is the problem of finding an acceptable model. A reduced or elevated hemoglobin is a consequence of many diseases and conditions. When studying patients longitudinally it is often difficult to separate the changes in DLCO that occur from the disease process and those that occur from changes in hemoglobin. For this reason changes in hemoglobin pre- and post-treatment in anemia and polycythemia have been studied most frequently.

The ATS/ERS currently recommends correcting DLCO for hemoglobin (although notably they recommend that the predicted DLCO be corrected, not the observed value) using the equations developed by Cotes et al in 1972. Cotes’ work was based on subjects with iron-defficienty anemia but just as importantly on theoretical considerations involving Roughton and Forster’s equation on the relationship between the membrane and hemoglobin components of the diffusing capacity:

1_over_DLCO_formula

Cotes

Continue reading

Hyperventilation Syndrome

While reviewing a CPET I noticed the patient had a low PETCO2 throughout exercise and an elevated Ve-VCO2 slope. In addition the patient’s minute ventilation was on the high side (75% of predicted) at peak exercise. This is something you might expect to see in association with pulmonary vascular disease but the subject had a normal DLCO; normal spirometry; their oxygen saturation was normal at all times; and they had a normal maximum VO2 and a normal VO2 at anaerobic threshold. Since there didn’t seem to be any clinical reason for the low PETCO2 I had to wonder whether it was due to hyperventilation syndrome (HVS).

Hyperventilation syndrome is something that everybody “knows” about but is still somewhat ill-defined and this is at least partly because it is most often diagnosed solely by patient-reported symptoms. My lab does not have any diagnostic criteria for hyperventilation syndrome and for this reason I decided to review the literature on the subject.

Hyperventilation syndrome is usually suspected when a patient has rapid, shallow breathing with an irregular breathing frequency and with frequent sigh breaths. Common complaints are dizziness, dry mouth, tingling sensations in the hands and feet and often in combination with chest pain. These symptoms may raise the suspicion that a patient has hyperventilation syndrome and the classic way to diagnose HVS is has to have the patient perform a Hyperventilation Provocation Test (HVPT). During this test a patient voluntarily hyperventilates for three minutes and is then asked whether they felt the symptoms they had been complaining of occurred while they were hyperventilating.

The causes of HVS are considered to be primarily psychosomatic and the majority of articles written on the subject primarily explore this aspect. There are surprisingly few articles on the physiology of HVS and for this reason the physiological causes and consequences of HVS are poorly understood. Of note, I reviewed a couple dozen textbooks on pulmonary function testing and pulmonary diseases that I have on hand and found hyperventilation syndrome to be mentioned in only one (Cotes) where it merited one relatively small paragraph.

Continue reading

Have you checked the math on your reports lately?

Once again my lab was questioned by a research study’s primary investigator and study coordinator about why our lung volume results came out significantly lower than another lab’s. In order to be part of this study a subject has to have an RV that is greater than 150% of predicted. The RV we had obtained on a subject referred to the study was over a liter less than the results they had brought with them from another lab and for this reason the patient no longer qualified.

When I reviewed the subject’s test data from my lab it was clear to me that our test quality was good and more than met the ATS/ERS reproducibility criteria. We were given a copy of the subject’s report from the other lab and at first glance, the results look very typical for emphysema. Specifically the report showed very severe airway obstruction, a normal TLC, an elevated FRC and RV consistent with hyperinflation and a severely reduced DLCO. Our results however, showed a mixed defect with severe obstruction and a mildly reduced TLC.

Getting accurate lung volume measurements is hard. Regardless of which measurement technique you use, in most instances any errors tend to cause lung volumes to be overestimated. When very severe airway obstruction is present unless you are careful about panting frequency, plethysmography will often overestimate FRC and TLC, and that may be what happened in this case.

But this isn’t about test quality or the reasons why I believe my lab is better than most others. Although the report was from a nearby hospital with a reputation for the quality of its patient care, when I started reviewing it I immediately started to see math errors among the predicted values. I’ve run across these kind of errors before but this report was from a different equipment manufacturer than last time and this means that these kind of errors are probably far more common than I ever would have expected.

Continue reading

Transgender PFTs

I was reviewing PFT reports today and noticed that a patient appeared to have had the wrong gender entered in their demographic information. Specifically, the patient had an unambiguously masculine name but had been entered as female. Just to be sure I checked the patient’s on-line medical record and there he was listed as male. I had noticed from the trend report that the patient had been in the PFT lab numerous times. Since the basic patient demographics (name, date of birth, height, gender, etc.) are automatically forwarded into a new demographics record when a new PFT lab visit is created it struck me as odd that after all this time we had somehow managed to make a mistake with something as basic as gender. For this reason I thought it would be a good idea to see how far back this problem existed and started going back through the patient’s PFT records. About four visits ago the patient’s name suddenly changed to one that was unambiguously feminine.

I was immediately concerned that two different patient’s records had somehow gotten merged. The last time this happened was over 20 years ago and was due to an entry error in the patient ID that was further compounded by how the lab’s software handled new demographic records at the time. Merged records is therefore a symptom of a serious database problem but when I compared the date of birth of the two patients, I was immediately able to see that they were the same. Since this is incredibly unlikely my thought then was that the patient may have had a gender reassignment. When I went back to the patient’s online medical record and searched more carefully, I was able to find that this had occurred over a year ago. This is not the first time we’ve had a transgender patient and so it is an issue we’ve learned how to handle.

So what effect does gender reassignment have on an individual’s pulmonary function test results?

None whatsoever. Gender reassignment by itself does not affect FVC, FEV1, TLC or DLCO. What it does affect is how we interpret the test results and it can also cause some interesting data management problems that are worth noting.

All pulmonary function reference equations differentiate between genders. Although the differences between races and ethnicities is somewhat open to question, there is little doubt about the differences between genders. When individuals with the same height are compared, females universally have lower flow rates, volumes, respiratory muscle strength, gas exchange and oxygen consumption than males. Because lung function is determined during an individual’s childhood and adolescent developmental periods, gender reassignment does not affect lung function and when it is assessed this has to be done using reference equations that are appropriate to an individual’s original gender.

Depending on which way a gender reassignment occurs, results that would be considered normal for a female would likely look reduced for a male, and results that would be considered reduced for a male would likely look normal for a female. The selected gender will therefore make a difference about what an individual’s PFT results look like to a reviewer.

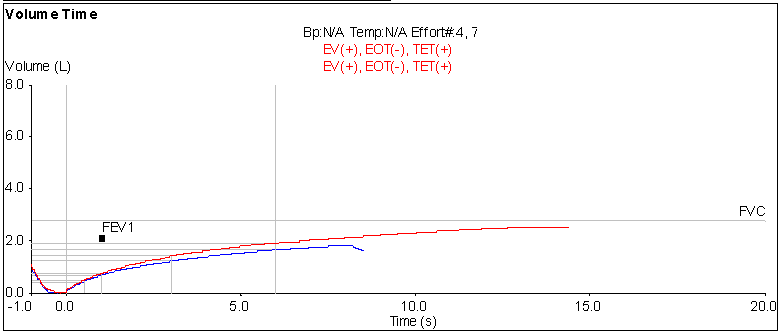
The patient whose gender raised this issue has relatively severe lung disease and is probably not the best example for this, but its what’s in front of me right now.

Female: Observed: %Predicted: Predicted:
FVC: 1.37 42% 3.25
FEV1: 0.92 36% 2.54
FEV1/FVC: 67 84% 80
TLC: 2.69 54% 4.93
RV: 1.34 79% 1.69
DLCO: 14.90 78% 19.12

Continue reading

How does a CPET show a Cardiac Limitation?

Recently a patient was referred to my lab for a CPET by his oncologist. The patient had been complaining of excessive shortness of breath particularly when climbing only a few stairs. The patient recently had a full PFT panel (spirometry, lung volumes, DLCO) and the results had showed mild restriction with a mild gas exchange defect. The patient’s shortness of breath symptoms were far more severe than could be explained by his PFTs however, so he had been referred to Cardiology and had an ECG stress test. The stress test results were normal so Cardiology told the oncologist that the patient’s problems were probably not cardiac.

Because the patient’s PFT results were reduced the patient’s oncologist consulted with a couple of our pulmonary physicians and they suggested a CPET. When I reviewed the patient’s CPET results despite a mildly reduced TLC and DLCO it was quite clear the patient’s primary limitation was in fact cardiac. Why was there such a discrepancy between Cardiology’s ECG stress test and our CPET? The simple answer is that a CPET measures oxygen consumption and a routine ECG stress test does not.

Strictly speaking, during a progressive exercise test any individual with normal heart and lungs usually reaches a cardiac limit before they reach any kind of a pulmonary limit and this is normal. A fit, athletic individual usually has a higher than normal stroke volume (and cardiac output) while a somebody that is out-of-shape has a reduced stroke volume (and cardiac output). This is one of the key differences between being conditioned and being de-conditioned.

So what are the hallmarks of an abnormal cardiac limitation?

There are, of course, many different types of cardiac disease but the common factor (at least in terms of a CPET) is an abnormal decrease in cardiac output. Cardiac output cannot be measured during exercise without specialized equipment or indwelling catheters but there is an intimate connection between cardiac output and VO2 as shown by the Fick equation:

Fick_Equation

Note: CaO2 and CvO2 refer to the oxygen content (in vol%) of arterial and venous blood respectively. I’ve frequently seen CaO2 and CvO2 described as the concentration of oxygen in the blood but although this may be semantically correct I feel it is imprecise because it is easily confused with the partial pressure of oxygen or oxygen saturation when it is actually a function of both of these properties:

O2_Content_Equation

Continue reading

Tidal flow-volume loops

I was reviewing a spirometry report and noticed something odd about the flow-volume loop, or more specifically the tidal loop, and this got me to thinking about what tidal loops can tell us about test quality, patient physiology and the ability of the technician to coach a spirometry test.

FVC_with_no_IC_Redacted2

There are at least a couple things wrong with this FVC test effort. First the exhalation time was only about 3 seconds so the FVC volume was likely underestimated by a fair amount. Second, it wasn’t reproducible and this was actually the patient’s the best test effort. What I noticed however, was that the tidal loop was shifted almost completely to the left.

There are a number of criteria for assessing the quality of a forced vital capacity. Exhalation quality can be determined reasonably well by back extrapolation, expiratory time and the terminal expiratory flow rate. When it comes to assessing the completeness of the inspiration that precedes the exhalation however, there really isn’t much to go on other than the reproducibility of an individual’s spirometry efforts.

When I measured the tidal loop what I saw was that IRV was about 0.10 L and the ERV, although likely underestimated by a fair amount, was at least 0.80 L. What I actually think this tidal loop is saying is that the patient didn’t take as deep a breath as they could at the start of the test, but what other things could affect the position of the tidal loop?

Continue reading

Diagnosing Mitochondrial Myopathies

I’ve been reviewing my CPET textbooks trying to get a better idea of how to differentiate between different cardiovascular limitations. The other day I ran across an article on a related subject and thought it might be instructive.

The hallmark of cardiovascular limitations is the inability to deliver enough oxygenated blood to the exercising muscles. Another limitation that has similarities to this (and one that is infrequently diagnosed) is the inability of the exercising muscle to utilize the oxygen delivered to it. The best examples of this type of exercise limitation are mitochondrial myopathies (MM).

The mitochondria are the primary source of the ATP used by exercising muscle. There are several conditions that can cause the number of mitochondria to be reduced and there is wide variety of mitochondrial genetic defects. Mitochondria have their own genes and these can have both inherited or acquired genetic defects which can cause anything from mild to severe decreases in the ability to produce ATP. Mitochondria require oxygen to produce ATP so when the number of mitochondria are reduced or their ability to produce ATP is reduced the rate at which oxygen is consumed by an exercising muscle is also reduced.

A relatively common complaint of individuals with MM is dyspnea and exercise intolerance. One study found that 8.5% of all the patients referred to a dyspnea clinic had a mitochondrial myopathy of one kind or another. A definitive diagnosis requires a muscle biopsy but because the symptoms are often non-specific and a biopsy is an invasive procedure, it is usually not performed unless there more significant evidence suggesting a MM.

Continue reading