Assessing post-BD improvement in FEV1 and FVC as a percent of the predicted

The 2005 ATS/ERS standards for assessing post-bronchodilator changes in FVC and FEV1 have been criticized numerous times. A recent article in the May issue of Chest (Quanjer et al) has taken it to task on two specific points:

  • the change in FVC and FEV1 has to be at least 200 ml
  • the change is assessed based on the percent change (≥12%) from the baseline value

The article points out that the 200 ml minimum change requires a proportionally larger change for a positive bronchodilator response in the short and the elderly. Additionally, by basing the post-BD change on the baseline value it lowers the threshold (in terms of an absolute change) for a positive bronchodilator response as airway obstruction become more severe. As a way of mitigating these problems the article recommends looking at the post-bronchodilator change as a percent of predicted rather than as a percent of baseline.

The article is notable (and its authors are to be commended) because it studied 31,528 pre- and post-spirometry records from both clinical and epidemiological sources from around the world. For the post-bronchodilator FEV1 and FVC:

  • the actual change in L
  • the percent change from baseline
  • the change in percentage of predicted
  • the Z-score

were determined.

Continue reading

Is there such a thing as a normal decrease when the FEV1 isn’t normal?

I’ve mentioned before that my lab’s database goes back to 1990, so we now have 27 years of test results available for trending. At least a couple times a week we have a patient who was last seen 10 or even 20 years ago. When I review their results I try to see if there has been any significant change from their last tests. Since the last tests are often quite some time in the past the changes in an absolute sense are often noticeably large. The question then becomes whether or not these changes are normal.

Although the ATS/ERS, NIOSH and ACOEM standards for spirometry address changes over time they don’t specifically discuss changes over a decade or longer. Instead, without indicating a time period (other than saying a year or more), the concensus is that a change greater than 15% in age-adjusted FVC or FEV1 is likely to be significant. A change in absolute values greater than:

Or if the current FEV1 is less than:

Then the change is likely significant.

This sounds fairly reasonable and although we could quibble about the importance of how quickly or slowly this age-adjusted 15% change occurs and how well it applies when the patient’s latest age is beyond the reference equation’s study population (we have a fair number of 90+ year old patients nowadays) or when it’s across a developmental threshold (adolescent to adult), it’s still a good starting point.

I’ve been more or less following these rules for the last several years, when the results for a patient whose last test was 18 years ago came across my desk. The FEV1 from the current spirometry was 71% of predicted and the FEV1 from 18 years ago was 70% of predicted. Strictly speaking the absolute change was about -15% (the FEV1 was 2.06 L in 1999 and 1.76 L in 2017, a 0.30 L change) but when adjusted for the change in age, that’s only 40% what a significant change would need to be:

Given that the FEV1 percent predicted from both the older and newer test were essentially identical I automatically started to type “The change in FEV1 is normal for the change in age” when it suddenly occurred to me that neither FEV1 was normal in the first place so how could I be sure the change be normal?

Continue reading

Another post-BD FVC conundrum

Okay, this may be wrong but at the moment I’m can’t seem to find a reason why it should be. A report like this came across my desk a couple of days ago.

Observed: %Predicted: Post-BD: %Predicted: %Change:
FVC: 4.59 94% 4.87 100% +6%
FEV1: 3.38 89% 3.58 94% +6%
FEV1/FVC: 73.6 95% 73.5 95% 0

Not particularly unusual and it would usually be interpreted as being within normal limits without a significant post-BD change. If you calculate the FEV1/VC ratio using the pre-BD FEV1 and the post-BD FVC however, it’s 89% of predicted and this indicates mild airway obstruction. But you’re not supposed to use the post-BD FVC this way, are you?

Well, why not?

Continue reading

Is there airway obstruction when the FEV1 is normal?

I’ve been reviewing the literature on PFT interpretation lately and in doing so I ran across one of the issues that’s bothered me for a while. Specifically, my lab has been tasked with following the 2005 ATS/ERS guidelines for interpretation and using this algorithm these results:

Observed: %Predicted: LLN: Predicted:
FVC: 2.83 120% 1.76 2.36
FEV1: 1.77 100% 1.26 1.76
FEV1/FVC: 63 84% 65 75

would be read as mild airway obstruction.

Although it’s seems odd to have to call a normal FEV1 as obstruction I’ve been mostly okay with this since my lab has a number of patients with asthma whose best FVC and FEV1 obtained at some point in the past were 120% of predicted or greater but whose FEV1 frequently declines to 90% or 100% of predicted. In these cases since prior studies showed a normal FEV1/FVC ratio then an interpretation of a mild OVD is probably correct even though the FEV1 itself is well above the LLN, and this is actually the situation for this example.
Continue reading

The FVC/DLCO ratio. Will the real percent predicted please stand up?

Recently a reader asked me a question about the FVC/DLCO ratio. To be honest I’d never heard of this ratio before which got me intrigued so I spent some time researching it. What I found leaves me concerned that a lack of understanding about reference equations may invalidate several dozen interrelated studies published over the last two decades.

Strictly speaking the FVC/DLCO ratio is the %predicted FVC/%predicted DLCO ratio (which is usually abbreviated FVC%/DLCO%) and it appears to be used exclusively by specialists involved in the treatment of systemic sclerosis and related disorders. Specifically, the ratio is used to determine whether or not a patient has pulmonary hypertension. The basic idea is that (quoting from a letter to the editor):

“As we know, in ILD both FVC and DLCO fall and their fall is proportionate, whereas in pulmonary arterial hypertension DLCO falls significantly and disproportionately to FVC.”

A variety of algorithms using the FVC%/DLCO% have been devised. Inclusion factors are usually an FVC < 70% of predicted and a DLCO (corrected for hemoglobin) < 60% of predicted. A number of different threshold values for FVC%/DLCO% have been published ranging from 1.4 to 2.2 with the differences appearing to be dependent on study population characteristics and the type of statistical analysis performed. It is thought that individuals meeting the inclusion factors with an FVC%/DLCO% ratio above the threshold most probably have pulmonary hypertension.

Continue reading

When no change is a change, or is it?

I was reviewing a spirometry report last week and when I went to compare the results with the patient’s last visit I noticed that the FVC and FEV1 hadn’t changed significantly. However, the previous results were from 2009 and when the percent predicted is considered there may have been a significant improvement.

2009 Observed: %Predicted:
FVC: 2.58 87%
FEV1: 1.60 72%
FEV1/FVC: 62 82%
2016 Observed: %Predicted:
FVC: 2.82 104%
FEV1: 1.65 82%
FEV1/FVC: 59 79%

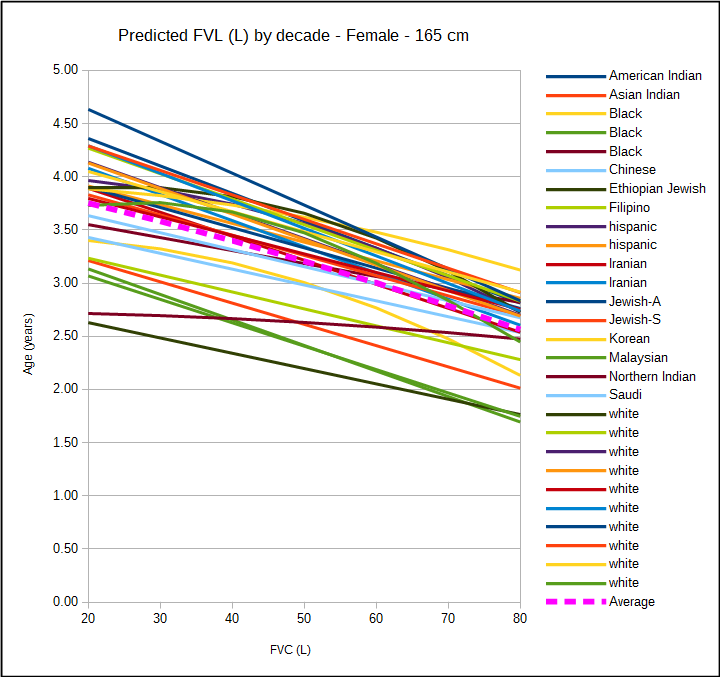
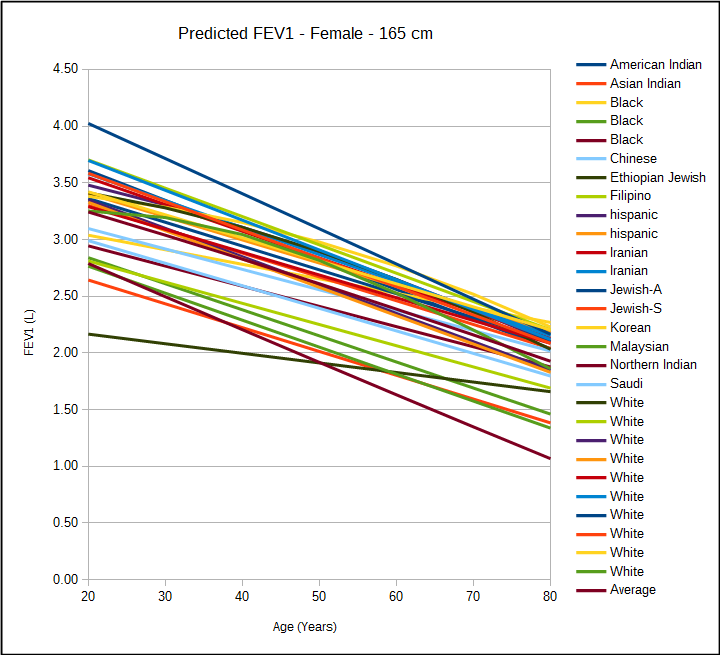
The answer to whether or not there was an improvement would appear to depend on what changes you’d normally expect to see in the FVC and FEV1 over a time span of 7 years. The FVC and FEV1 normally peaks around age 20 to 25 and then declines thereafter.

fvc_predicted_l

fev1_predicted_l

[more] Continue reading

Top 10 spirometry errors and mistakes

A couple of days ago my medical director and I had a short discussion about teaching pulmonary fellows to read PFTs and agreed that in order to be good at interpreting PFTs it isn’t the basic algorithms that are hard, it’s gaining an understanding of test quality and testing problems. My medical director then suggested this topic. At first I wasn’t sure I could find 10 errors but after spending a couple hours digging through my teaching files I managed to come up with just a few more than that. So strictly speaking it’s not a top 10 list but I kept the title because I liked it.

Spirometry errors and mistakes seem to fall into four categories: demographics, reference equations, testing and interpretation.

Demographics:

Normal values are based on an individual’s age, height and gender. When this information is entered incorrectly the normal reference values will also be incorrect. These errors often go uncaught because whoever reviews and interprets reports usually isn’t the same person who sees the patient and performs the tests. This type of error often doesn’t get corrected until the results are uploaded into a hospital information system or the patient returns for a second (or third or fourth) visit.

1. Wrong gender.

Pulmonary function reference equations are gender specific and for individuals with the same age and height, men will have a larger FVC and FEV1 than women do. When a patient’s demographics information is manually entered into a PFT system it’s always possible for somebody to enter the wrong gender. When this happens the predicted values will be either over- or under-estimated. This happens in my lab at least a half a dozen times a year and it’s why when I review reports I try to check the patient’s gender right after reading their name.

This is also a problem area for individuals who have gone through gender reassignment (transsexuals). An individual’s physiologic/developmental gender needs to be used to generate predicted values but this may be at odds with their gender recorded in a hospital’s information system. Some PFT lab systems populate their demographics information from their hospital’s information system when an order is received and it may or may not be possible to alter gender once this has happened. In other cases, an individual’s demographics may be cross-referenced when PFT results are uploaded into hospital information system and may throw an error if the wrong gender is present.

2. Wrong height

All lung volumes and capacities scale with height. Like any other manual entry height can be mis-entered and the most common error I’ve seen is for somebody to enter 60 inches when they meant 6 feet 0 inches.

Height can also be mis-measured if the patient isn’t asked to remove their shoes or to stand straight, or if the patient is asked for their height and it isn’t even measured. An error of an inch or two probably won’t make a big difference in a patient’s predicted values (particularly given the discrepancies between different reference equations) but for somebody who’s on the edge of normal and abnormal it can make a significant difference in how a report is interpreted.

Continue reading

When hypoventilation is the primary CPET limitation

Hypoventilation is defined as ventilation below that which is needed to maintain adequate gas exchange. It can be a feature in lung diseases as diverse as chronic bronchitis and pulmonary fibrosis but determining whether it is present of not is often complicated by defects in gas exchange. When desaturation occurs during a CPET (i.e. a significant decrease in SaO2 below 95%) this is a strong indication that the primary exercise limitation is pulmonary in nature and from that point the maximum minute ventilation and the Ve-VCO2 slope can show whether the limitation is ventilatory or instead due to a gas exchange defect. But in this circumstance what what does it mean when both the maximum minute ventilation and Ve-VCO2 slope are normal?

Recently a CPET came across my desk for an individual with chronic SOB. The individual recently had a full panel of pulmonary function tests:

Observed: %Predicted:
FVC (L): 1.73 62%
FEV1 (L): 1.39 66%
FEV1/FVC: 80 106%
TLC (L): 2.99 62%
DLCO (ml/min/mmHg): 14.66 84%
DL/VA: 5.45 124%
MIP (cm H2O): 11.5 18%
MEP(cm H2O): 21.3 24%

The reduced TLC showed a mild restrictive defect. At the same time the relatively normal DLCO indicates that the restriction is probably not due to interstitial lung disease and more likely either a chest wall or a neuromuscular disorder, both of which can prevent the thorax from expanding completely but where the lung tissue remains normal. The reduced MIP and MEP tends to suggest that a neuromuscular disorder is the more likely of the two.

I take this with a grain of salt however, and that is because this individual never had pulmonary function tests before and for this reason there is no way to know what their baseline DLCO was prior to the restriction. At the same time far too many individuals perform the MIP/MEP test poorly and low results are not definitive, and in this case in particular the results are so low the individual should have been in the ER, not the PFT Lab.

The CPET results were somewhat complicated, in that a close inspection showed both pulmonary and cardiovascular limitations.
Continue reading

Asleep at the wheel

During this last week I was contacted by two different individuals who were asking for help in understanding their PFT results. In both cases they had a markedly elevated TLC and the interpretation included the notation that they had gas trapping and hyperinflation. Even though the amount of information they provided was minimal I am extremely skeptical that the TLC measurements were correct.

Gas trapping usually only occurs with severe airway obstruction. Hyperinflation, which at minimum consists of a chronically elevated FRC and RV, usually only occurs after prolonged gas trapping. An elevated TLC usually occurs only with prolonged hyperinflation and given the improvements in the care and treatment of COPD I’ve seen over the last several decades, has become relatively uncommon.

But one individual had perfectly normal spirometry:

%Pred:
FVC: 107%
FEV1: 112%
FEV1/FVC: 105%
TLC: 143%

Continue reading

Does the FEV1/SVC ratio over-diagnose airway obstruction?

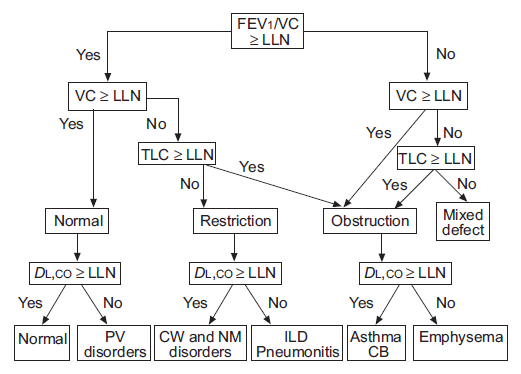
A low FEV1/VC ratio is the primary indication for airway obstruction.

ATS_ERS_Interpretation_Algorithm

From ATS/ERS Interpretive Strategies for Lung Function tests, page 956.

The ATS/ERS statement on interpretation says

The VC, FEV1, FEV1/VC ratio and TLC are the basic parameters used to properly interpret lung function (fig. 2). Although FVC is often used in place of VC, it is preferable to use the largest available VC, whether obtained on inspiration (IVC), slow expiration (SVC) or forced expiration (i.e. FVC).”

I understand and in general agree with the idea of using the largest VC regardless of where it comes from and this is because the FVC is often underestimated for any number of good (and not so good) reasons. When this happens the FEV1/FVC ratio will be overestimated and airway obstruction will be under-diagnosed. However the ATS/ERS statement is also grounded in the notion that all vital capacities (FVC, SVC, IVC) are the same and this isn’t necessarily true. The problem comes from the fact that the predicted values and lower limit of normal (LLN) for the FEV1/VC ratio always come from reference equations for FEV1/FVC ratios. Because the SVC (and IVC) are usually larger than the FVC this means there is at least the potential for airway obstruction to be over-diagnosed.

Continue reading