One of the overlooked parts of teaching pulmonary function interpretation is developing an appreciation for the number and variety of errors that the equipment, patients and technicians can produce and how they affect the reported test results. I routinely run across a couple dozen errors each week while reviewing reports. Most are minor and do not significantly affect the reported results. Many are mundane because they appear so often and a few are interesting because they point out a particular limitation in the equipment, software or testing standards. I’ve kept a file of the more iconic examples of testing errors for years and a while ago a pulmonary staff physician and I used to hold weekly sessions for fellows and residents where we’d present a number of “zingers” to see if they could figure them out. Unfortunately that physician has moved on to a different institution and I’m no longer as available as I used to be so these sessions are no longer held but I think that they or something like them should be held in all teaching hospitals.
These spirometry results came from a middle-aged woman with sarcoidosis.
| Observed: | %Predicted: | Predicted: | |
| FVC: | 3.55 | 155% | 2.29 |
| FEV1: | 1.06 | 60% | 1.77 |
| FEV1/FVC Ratio: | 30 | 39% | 77 |
Elevated FVC’s are not all that uncommon (and are a good example of the limitations of reference equations), but one that is 155% of predicted is particularly unusual. This occurs most commonly when somebody has made an error in measuring or entering the patient’s height (I can’t tell you the number of times I’ve seem someone entering 60 inches when they meant 6 feet), but this patient has been seeing pulmonary physicians and having regular spirometry tests for over a decade and the height for this test was the same as it was for the previous visit. In addition the trend report showed that over the last year the patient’s FVC had been between 71% and 65% of predicted.
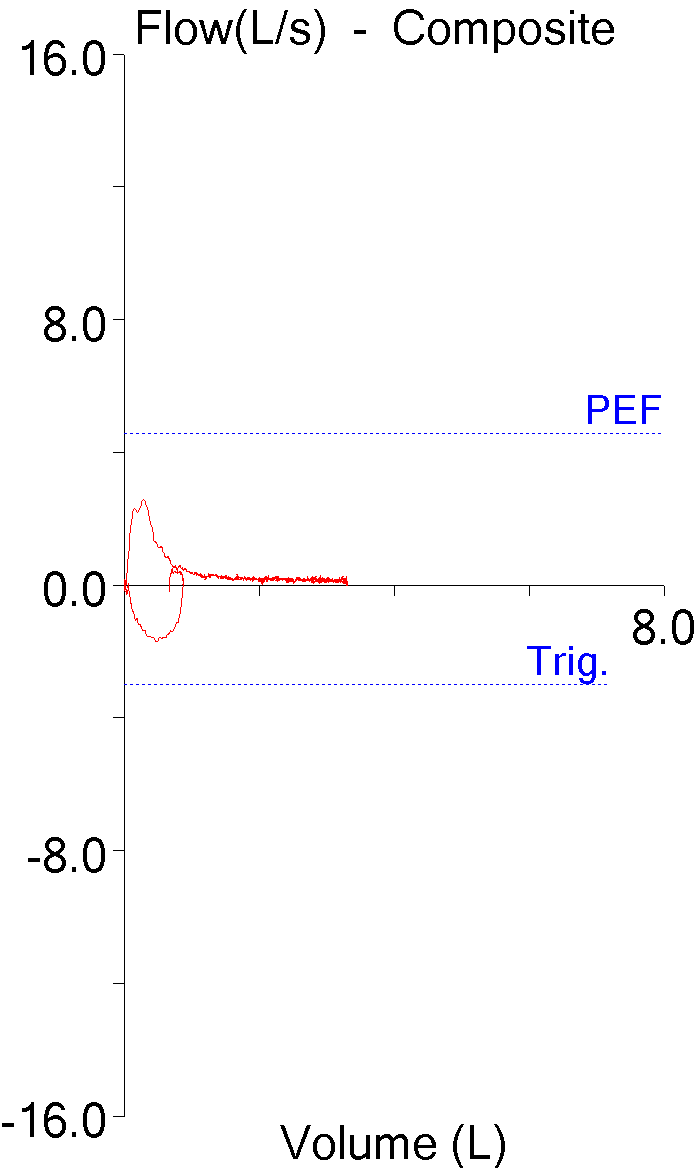
The flow-volume loop doesn’t look overly unusual although the expiratory flow doesn’t taper off to zero and the patient maintained a low expiratory flow for at least two-thirds of the vital capacity.

The volume-time curve is actually quite unusual and shows a flat section where the exhaled volume steadily increased for over 10 seconds. Most volume-time curves approximate an exponential decay curve which looks quite different. The volume-time curve does flatten at the end, but flattening is abrupt.
The final clue was in the technician’s notes:
“Dx: Sarcoid. Medication: Albuterol, none recently. 2 LPM supplemental O2, transtracheal. Good test quality and reproducibility.”
The majority of patients that receive supplemental O2 get it via a nasal cannula. The patient had been on supplemental O2 for the last couple of years but although her spirometry results aren’t too terrible, her disease process had continue to advance. In between the last visit and the current visit the patient had been fitted with a transtracheal catheter and was now receiving her supplemental O2 through that.

The problem was that during spirometry the supplemental O2 has not been turned off and that oxygen was being added to the patient’s trachea throughout the maneuver. This caused her FVC (and to a much lesser extent her FEV1) to be significantly overestimated. Interestingly, the patient performed four maneuvers and the FVC and FEV1 for three of them met the ATS/ERS criteria for repeatability.
This is a simple procedural error but there were at least two opportunities for the technician to have recognized there was a problem. First, any FVC that is 155% of predicted should be throwing up all sorts of warning flags. Admittedly only a tiny fraction of our patient’s have transtracheal catheters but there are any number of other reasons why that large of an FVC means that there has been error of some kind. Second, the fact that the FVC was at least twice as large as any of the FVCs the patient had performed in the last year and that should be a warning flag all by itself.
The technician that performed the test later said they had never had a patient with transtracheal O2 before and that may well be true. That doesn’t explain the “good test quality” comment in the notes but I think that all too often technicians (and really this applies to all of us) are on “autopilot” and aren’t paying as much attention as they should, particularly when it comes to entering notes.
There are numerous textbooks and manuals that teach PFT interpretation. The possible mechanical, software, procedural, patient and technician errors that can occur with testing is often only marginally discussed when it is discussed at all. To some extent this is understandable because error detection is often far more complex than the actual interpretation process. The most critical component of interpretation that needs to be taught however, is skepticism. When reviewing PFT reports the first step should always be to ask what’s wrong with the results and only you’ve been assured they are reasonably correct or that you know which direction the errors are biased towards should an interpretation be attempted.
Note: One reason that none of computer algorithms for interpreting PFTs have ever been reliable is that they all assume that the test results are completely accurate. Although I doubt that all errors could ever be automatically detected there are numerous routine errors that could be. Sadly however, I’ve never seen any attempt to do this by either the developers of algorithms or by equipment manufacturers.
But even with a sense of skepticism it can often be hard to find the evidence needed to determine that an error is present. Over the last year I’ve had the opportunity to take a look at the on-line signing applications from three of the four largest PFT equipment manufacturers in the USA. There are differences in each approach to on-line signing but one feature they share is that the signing physician can only view the final report. None of them have any easy way for a signing physician to review raw test data or to compare the multiple efforts a patient has attempted and some actually make this quite difficult (I won’t say impossible but having to switch to a different computer and a different application is certainly setting the bar high).
Physicians that use these on-line signing systems are therefore dependent on the choices made by PFT lab staff. To one degree or another this has always been true, but I would have thought that the ability to quickly and easily drill down into the patient’s test data would have been considered to be a critical part of on-line signing. Perhaps at some point it will be but until that time the recognition of errors and the selection of the most accurate patient results most often rests in the hands of the technicians performing the tests.
I used this particular example with at least two dozen groups of fellows and residents over the course of a couple years. So how well did they do at recognizing a problem with this patient’s test? Most of residents didn’t think there was a problem. Most of the pulmonary fellows realized there was a problem but the majority or them thought that the patient height or gender was incorrect and a few thought it might be an equipment problem of some kind. Nobody ever guessed that it was because of transtracheal O2.

PFT Blog by Richard Johnston is licensed under a Creative Commons Attribution-NonCommercial 4.0 International License