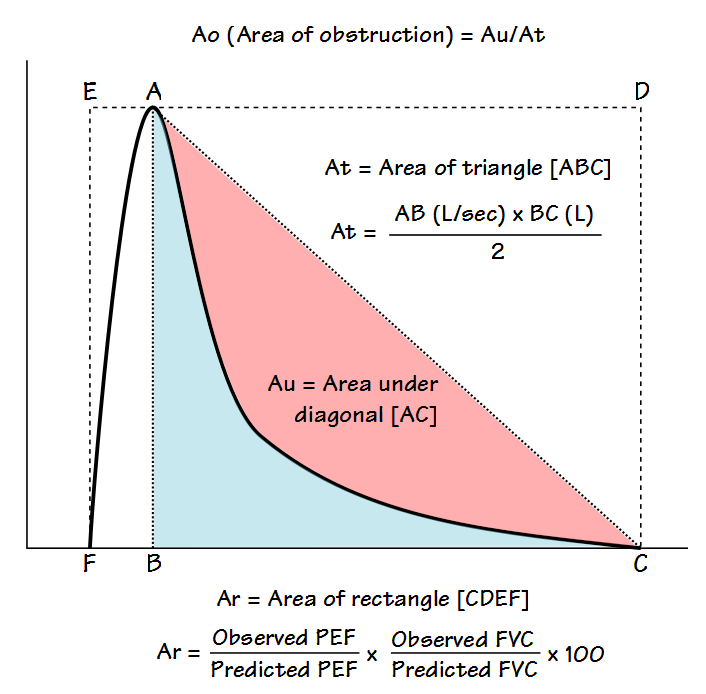
I’ve been thinking a bit about the shape of flow-volume loops lately. In part this has been about ways to accurately describe them in reports; in part speculation about the information that may be embedded in them that isn’t in any of the routinely reported spirometry values; and in part about how the human eye perceives and categorizes them in a way that is difficult to simplify and put into a computer algorithm. A couple days ago I found a recent article where a geometrical analysis was applied to flow-volume loops in individuals with COPD and this got me curious about what other graphical techniques have been used to analyze flow-volume loops.
Given how long flow-volume loops have been around (over 50 years) the graphical analysis of flow-volume loops has been attempted remarkably few times. Excluding a handful of strictly numerical approaches (based primarily on MEF and MIF ratios) I was only able to find three graphical analysis techniques. I think this small number says volumes about the difficulty of analyzing flow-volume loop shapes meaningfully. Despite different degrees of sophistication the reality is that none of these techniques has ever seen any kind of common usage. Even so these attempts are both interesting and instructive.
The most recent technique is a fairly straightforward geometric approach from Lee et al and its use appears to be limited primarily to individuals with airway obstruction.
The flow-volume loop is analyzed primarily to determine what the authors call the Area of Obstruction (Ao). To do this, a diagonal line is drawn from peak flow to the end of exhalation. The area that exists between the actual flow-volume loop contour and this diagonal line is defined as the area under the diagonal (Au). The area of Au is then compared to the area of a triangle (At) defined by the peak flow, the exhaled volume at the time of the peak flow, and the end of exhalation. The area of obstruction, which is actually a ratio, is then calculated as:

