Recently a rather eminent reader commented on an older blog entry. He finished his comment with a paragraph on another topic, however. Specifically:
By the way, it is also high time that we scuttle the habit of expressing a measurement as percent of predicted. As Sobol wrote [5]: “It implies that all functions in pulmonary physiology have a variance around the predicted, which is a fixed per cent of predicted. Nowhere else in medicine is such a naive view taken of the limit of normal.”
I understand the point and have been thinking about this off and on since the comment was posted but I keep coming back to the same response, and that is “yes, but…”.
First the “yes” part.
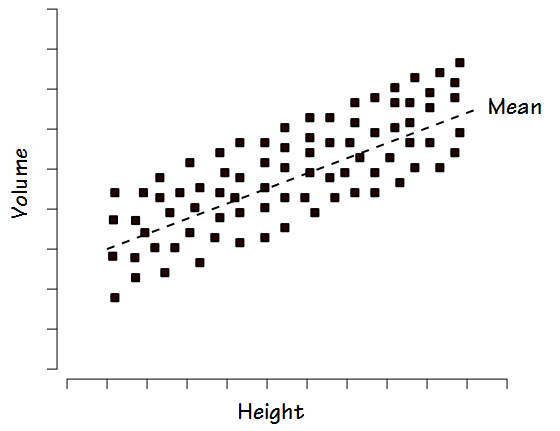
Other than the fact that any percent of predicted cutoff is an arbitrary line in the sand (80% of predicted is most commonly used as the cutoff for normalacy but why not 75%? why not 85%?) the biggest argument against the use of percent predicted is the way in which normal values tend to be distributed. When FVC or TLC is studied within a reasonably large group of “normal” individuals the results are usually distributed fairly evenly above and below the mean. This is referred to as a homoscedastic distribution.
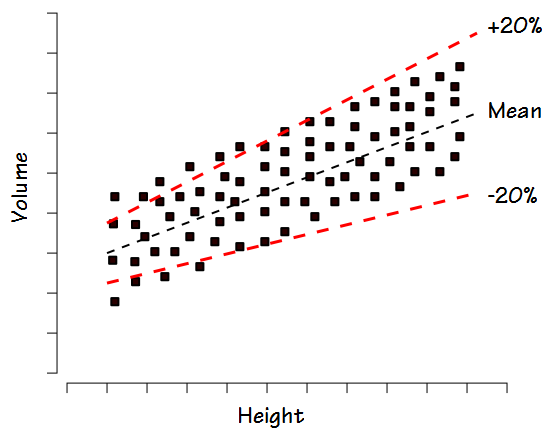
For this reason when, for example, +/- 20% is used as the normal range this tends to exclude some normal individuals with lower volumes and heights and includes some individuals with larger volumes and heights that are probably not normal.
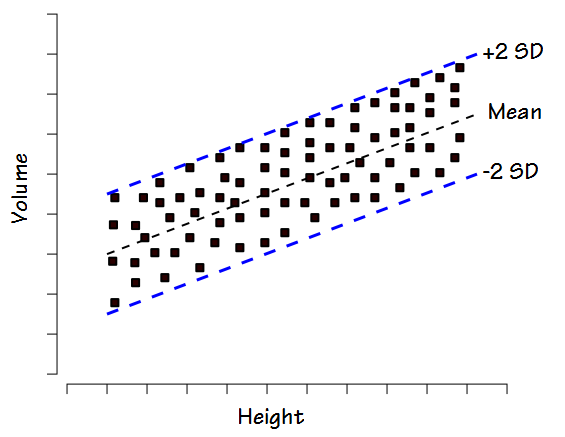
In fact a homoscedastic distribution is much better characterized by the standard deviation of the group and more specifically, +/- 2 standard deviations.
It would therefore appear that the normal range would be more closely related to standard deviation (or other statistical value) than the percent predicted. This however, is where we get to the “but” part.
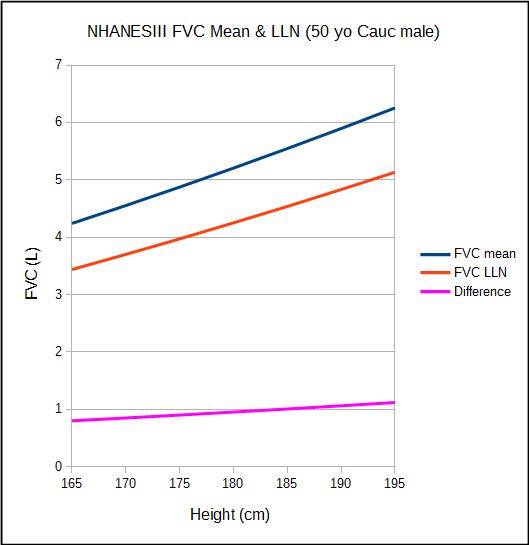
I am not a statistician and probably know just enough about statistics to get myself into trouble, but the first problem I have with this is that it assumes that the normal population is truly homoscedastic. The NHANESIII study is well known both due to both the size of the population it studied and to its sophisticated statistical analysis. It includes reference equations for both mean and LLN values. When FVC is plotted as a function of height, it becomes clear that the difference between the mean and LLN values are not constant, which would be the case if they were a function of the standard deviation, but instead vary steadily over the normal height range. This doesn’t mean that the NHANESIII LLN isn’t accurate but it does imply that the data set isn’t completely homoscedastic.
The second problem I have is that the concept of the LLN as it is usually applied also has some arbitrary elements. When a study population has a Gaussian distribution (bell-shaped curve), by definition 95% of the normal values fit within +/- 2 standard deviations.
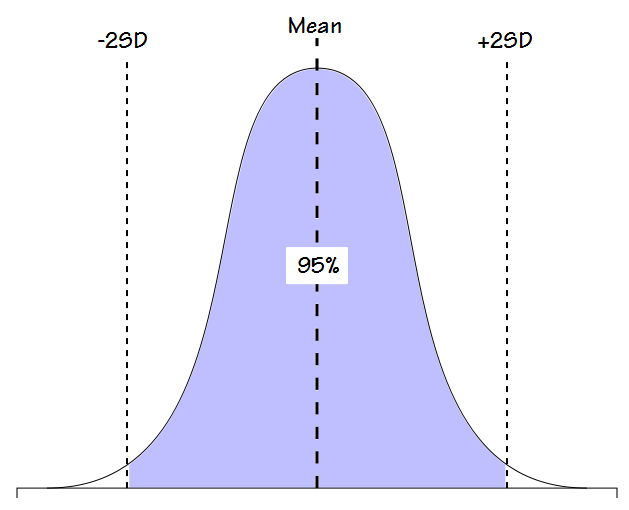
Because the remaining 5% is much more widely spread out it has been generally decided that a function that consists of 95% of the population is likely the best description of normalacy. That’s a fairly reasonable line in the sand (although in its way just as arbitrary as an 80% cutoff) but for values like FVC and FEV1, results that are above +2 standard deviations are considered to be normal, not abnormal. As one study somewhat succinctly stated:
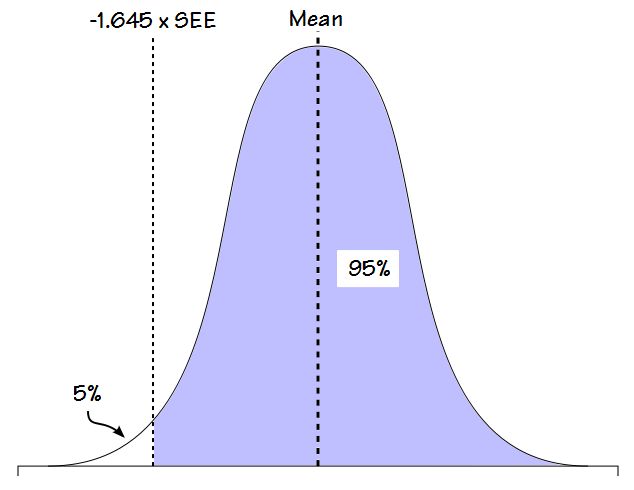
“Since the upper limits are not relevant in clinical spirometry, the 5% error can be transferred…”
For this reason, it is the bottom 5% of the population that is considered “abnormal” and although the LLN is calculated from the standard deviation (or the standard estimate of error, SEE, which is mathematically related to SD), it is a factor less than 2 (usually 1.645).
Part of the arbitrariness of this is that at first glance the decision to consider the bottom 5% abnormal makes sense when applied to FVC and FEV1 because reductions in these values are usually indications of one lung disorder or another and therefore elevated values are “normal”. This may well be true (and probably is) but it’s really just an assumption because I’ve never seen a single study of individuals with elevated FVC’s and FEV1’s and for this reason it’s not possible to say that there isn’t some pathology associated with elevated values.
Note: I see FVC and FEV1 results that are 130% to 140% of predicted at least a couple times a month. If this was simply a scaling issue I’d assume that the functional gas exchange surface area would scale with it but when DLCO is also measured I often find it to be normal (often with a reduced or low normal DL/VA) instead of being elevated as well. This may not be considered to be pathological but what combination of anatomy and physiology is causing lung volume and airway diameter to increase without increasing functional surface area?
For values like TLC and RV however, there are lung disorders associated with both elevated and reduced results and for this reason, reference equations usually include an upper limit of normal as well as a lower limit of normal. So, who’s (arbitrarily) deciding which values should have only a LLN and which should have an ULN and LLN? And which of these models applies to DLCO?
Finally, both the mean and standard deviation and therefore what is considered normal are dependent on the makeup of the population being studied. As an example, what if a group of Olympic athletes were studied? Using the above statistical assumptions 5% of them (and probably most of the rest of us) would have to be considered abnormal. This isn’t really true however, and points out at least one limitation to a purely statistical approach to defining normalacy.
More importantly however, this is where ethnicity comes into play. The differences between ethnicities often place one well outside the normal limits of another and this is the elephant in the room when pulmonary function statistics are discussed. There has yet to be a workable definition of what constitutes ethnicity and the selection of which one applies to a given individual has significant implications for the interpretation of their test results but is often arbitrary.
Statistical analysis is also dependent on which values are selected for analysis and I think that the apparent differences between ethnicities is exacerbated by the continued insistence on using standing height as a primary factor when analyzing pulmonary function results. Yes there is a relationship between height, lung volume and airway diameter but it is well known to be only approximate. Sitting height, for example, has been shown to be at least slightly more accurate than standing height but when was the last time you saw it used in a population study? There are probably other anthropometric measurements (or combinations of measurements) that are likely better than standing height but there has been remarkably little research in this direction.
So what does this all mean? Yes, using a fixed percentage of some kind as the cutoff for normalacy is likely inaccurate; partly because it does not accurately reflect the probable distribution of normal values and partly because any fixed percentage is arbitrary. Yes, a statistically defined LLN is more likely correct; partly because it more accurately reflects the distribution of normal values and partly there is better evidence that the normal range it describes is clinically relevant.
But the LLN also has its share of arbitrary elements and is also limited by the population being studied and the values used in analysis. In addition an 80% cutoff isn’t quite as horribly inaccurate as it is often portrayed and in instances where there are limitations in population studies and their reference equations (notably lung volumes and DLCO) it’s not as evident as it might be that the LLN is superior.
The ATS/ERS currently recommends using the LLN as the cutoff for normalacy. When reference equations come from studies with large populations and good statistical analysis this makes sense. When reference equations are from more limited studies however, the advantage of an LLN over an 80% cutoff isn’t quite as clear as many statisticians would like you to believe. Ethnicity remains the elephant in the room however, and until such time as reference equations are developed that are not dependent on ethnicity the differences between study populations often overshadows the differences between fixed cutoffs and the LLN.
So, yes, but….
References:
Aggarwal AN, Gupta D, Behera D, Jindal SK. Comparison of fixed percentage method and lower confidence limits for defining limits of normality for interpretation of spirometry. Respir Care 2006; 51(7): 737-743.
Culver BH. How should the lower limit of the normal range be defined? Respir Care 2012; 57(1): 136-143.
Hankinson JL, Odencrantz JR, Fedan KB. Spirometric reference values from a sample of the general U.S. population. Am J Respir Crit Care Med 1999; 159: 179-187.
Sobol BJ, Weinheimer B. Assessment of ventilatory abnormality in the asymptomatic subject: an exercise in futility. Thorax 1966; 21: 445-449.
Sobol BJ, Sobol PG. Editorial. Per cent of predicted as the limit of normal in pulmonary function testing: a statistically valid approach. Thorax 1979; 34: 1-3.

PFT Blog by Richard Johnston is licensed under a Creative Commons Attribution-NonCommercial 4.0 International License
80% of predicted may approximate to a population lower level of normality for FEV1 (as per Christie and Bates original text book introduction of this methodology) but this is not true for all lung function indices in the way that people have been using it. Your arguments about arbitrary levels is unfounded. The levels are chosen to give the user an understanding of the likely false positive rate. The LLN is taken as the lower 90% confidence limit because lung function tests are usually undertaken on people who have a clinical an indication which raises the a priori probability of an abnormality. So the lower 90% confidence limit is taken to increase sensitivity with some loss of specificity (mitigated by the raised prior probability). If one undertakes lung function tests on an asymptomatic population (that is with no a priori reason to do the test) then the lower 95% confidence limit should be used. This means the user knows the likelihood of what percentage of a ‘normal’ population might have a result below this level (2.5%). For 80% of predicted the user has no idea of what the possible false positive rate would be. For some lung function indices 80% of predicted will lead to many false negatives since the lower 90% confidence limit for a ‘normal’ population is above 80% of predicted.
The other problem with percent predicted is that it retains age, sex and height bias, the very things you are trying to take into account, so decisions are made about patient management in a non-uniform manner.
In the USA clinicians have used percent of predicted since its inception in the early 1960’s and are wedded to it; they fell confident about the decisions they are making but the article in CHEST 2011; 139(1):52 –59 points out that using percent of predicted will misclassify 20% of patients.
Dr. Miller –
Thank you for your clarification. There is no doubt that if I’d found your Chest article I would have written this a bit differently. I deliberately avoided talking about the differences between the GOLD, LLN and Percent Predicted standards for the FEV1/FVC ratio (saving that for another time), since that doesn’t really seem to be open to question. That issue is a core part of the Chest article you referenced, and given the differences between them it isn’t surprising that there would be significant differences in classification. And although I would agree that the use of the LLN has a firmer scientific basis this does not alter that fact that the available reference equations for lung volumes and DLCO, particularly because of their methodologies and small number of participants (Crapo=single breath TLC, 123M/122F / Miller=Ogilvie BHT, non-smokers=74M/94F), have limited statistical validity. Finally, given the differences between ethnicities (and even within them) there remains the question as to what constitutes a ‘normal’ population. So, yes the LLN “fixes” some classification issues but that doesn’t mean there still aren’t significant problems with the issue of who and what should be considered “normal”.
Regards, Richard
Hi Richard
It is certainly a complex world and we have to start from somewhere. In the field of science it is best to stick to the best we know than do something completely random. 80% predicted is completely random. LLN follows accepted statistical practice and gives one a handle on what the likely errors are. Percent predicted still uses a predicted value so all the arguments about which equations to use and how good a fit are they are common to both approaches.
Key to this is that it is the patient who suffers by getting this all potentially wrong, not the clinician. All the clinician has to lose is their pride and sadly this is preventing the move to a scientifically based methodology. I put in a letter to the Blue Journal that I think patients and research funders are going to look back harshly at the profession that has stuck with GOLD in the face of the evidence and so has crippled research into COPD for over 10 years. See our article in the BMJ on this – BMJ 2015;351:h3021 doi: 10.1136/bmj.h3021 (Published 1 July 2015).
The GOLD group just want us to go away and give up the argument. Someone has to argue on behalf of the patients. Vestbo said to me at a heated meeting in Copenhagen some years ago that if GOLD were to start again they would not adopt the fixed ratio. This proves that it is just pride that prevents them from moving forward on this.
Best wishes
Martin