The VA/TLC ratio

I was reading James Hansen’s textbook on pulmonary function testing (one of my more interesting reads lately) and in passing he mentioned using the VA/TLC ratio as a way to measure ventilation inhomogeneity. The VA/TLC ratio has also been called the Va,eff/VA ratio and the VA’/VA ratio by different researchers but regardless of what it is called it is the ratio between a single-breath TLC measurement (VA) taken from a DLCO test and a multi-breath (helium dilution or N2 washout) or plethysmographic TLC.

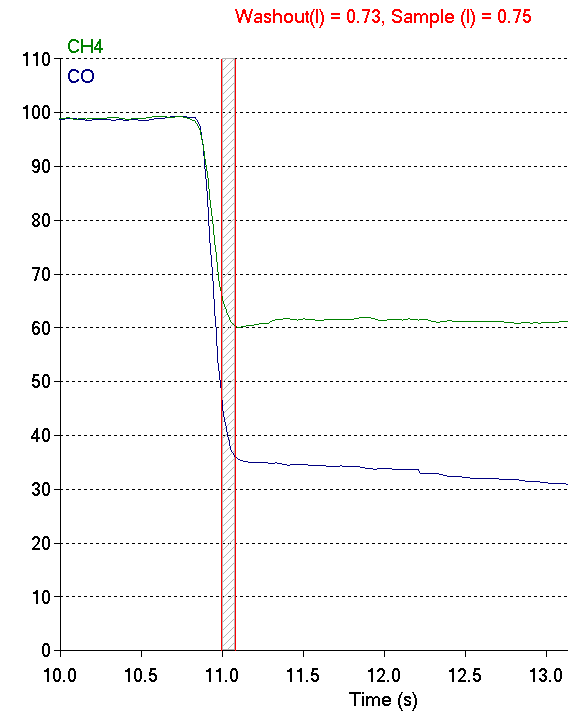
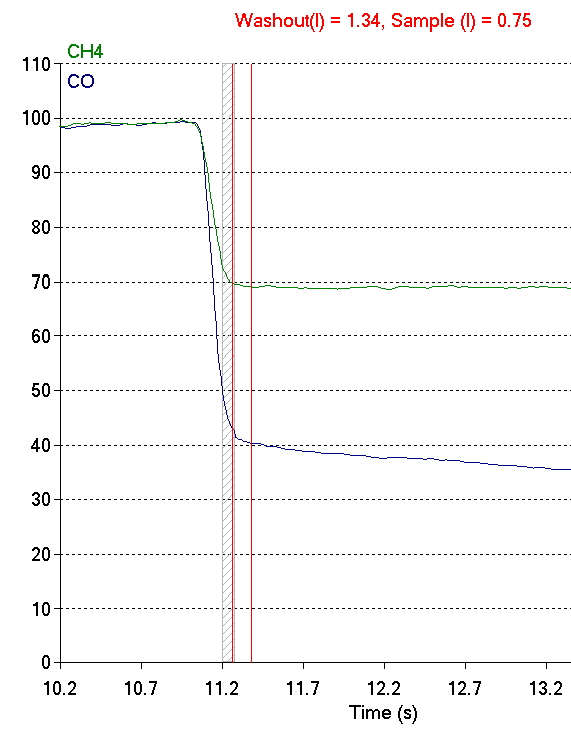
A single-breath TLC regardless of whether helium, nitrogen, methane or argon is used tends to underestimate TLC even in individuals with normal lungs (and if the ratio > 1.0 then there is likely a technical problem with either the lung volume or DLCO measurements). This is mostly because of the limited time a single breath of tracer gas has to mix and diffuse evenly throughout the lungs. The idea is that a low VA/TLC ratio indicates poor gas mixing and therefore an elevated ventilation inhomogeneity.

The VA/TLC ratio is a relatively simple approach towards measuring ventilation inhomogeneity largely because the results can be derived from regular TLC and DLCO measurements. It was first proposed as a measurement over 40 years ago but despite having several notable proponents it has not achieved any particular level of acceptance.

Part of the reason for this may be that there is limited agreement about what a constitutes a normal VA/TLC ratio. Cotes et al suggest that the ratio decreases slightly with age and stated that the normal range is 0.9 to 1.0 at age 20 and 0.85 to 0.95 at age 60. Roberts et al, however, in a study with a reasonably large population (n=379) selected for the presence or absence of certain conditions (normal, asthma, COPD) found no particular correlation with age (or height, weight and gender) and stated that in individuals with normal FEV1/FVC ratios the LLN was 0.828. Punjabi et al in a retrospective study of 5369 individuals unselected except for the presence of acceptable test quality stated that for FEV1/FVC ratios above 0.70 the VA/TLC ratio was 0.98.

There is general agreement however, that the strongest correlation between TLC and VA is an individual’s FEV1/FVC ratio.

VA/TLC ratios from Burns et al.

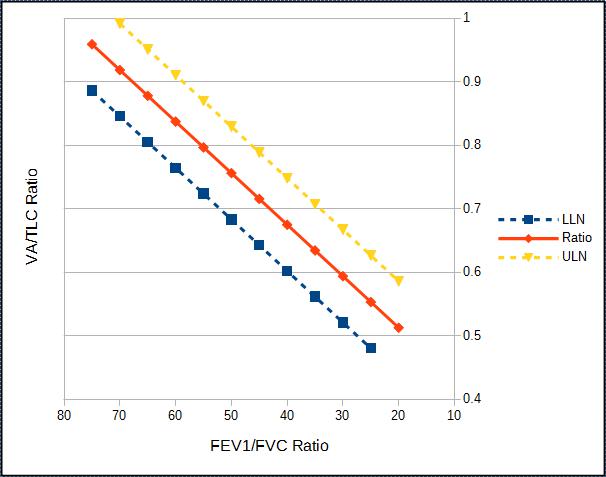
The correlation between VA/TLC ratio and the FEV1/FVC ratio from Burns et al.

VA_TLC_Ratio_Formula_Burns

Continue reading

Washout volume, transit time and DLCO

Recently while reviewing PFT reports I ran across a test from a patient who had been having spirometry, lung volume and DLCO tests performed at regular intervals for the last several years. Compared to the last several set of tests the most recent DLCO had decreased significantly while the FVC, FEV1 and TLC hadn’t changed. I took a closer look at the raw data from the DLCO test and when I did I saw that the washout volume was not correct.

Alveolar_Sample_Unadjusted_Cropped

Or more correctly, even though the washout volume matched the ATS/ERS standard for DLCO testing it was evident the expiratory gas sample was not taken from the alveolar plateau. The CO and CH4 concentrations at this point in the exhalation are higher than they are in the alveolar plateau and this means the reported DLCO was underestimated.

Alveolar_Sample_Adjusted_Cropped

When I re-adjusted the washout so the gas sample was taken from the alveolar plateau, the DLCO went from 18.56 ml/min/mmHg to 22.26 ml/min/mmHg, which is a 20% increase and far more in line with the patient’s prior DLCO test results.

This, however, increased the washout volume from 0.75 L to 1.34 L. Why was the washout volume so high? The answer is it probably wasn’t.

Continue reading

The effects of Obesity on lung function

Obesity has become far more commonplace than it was a generation ago. The reasons for this are unclear and have been attributed at one time or another to hormone-mimicking chemicals in our environment, altered gut biomes, sedentary lifestyles or the easy availability of high calorie foods. Whatever the cause, obesity affects lung function through a variety of mechanisms although not always in a predictable manner.

Spirometry:

Many investigators have shown a relatively linear relationship between an increase in BMI and decreases in FVC and FEV1. These decreases are small however, and FVC and FEV1 tend to remain within normal limits even in extreme obesity. The decreases in FEV1 and FVC tend to be symmetrical which is shown by the fact that the FEV1/FVC ratio is usually preserved in obese subjects without lung disease. Several studies have shown that the decreases in FVC and FEV1 are reversible since a decrease in weight showed a corresponding increase in FVC and FEV1.

In one study a 1 kg increase in weight correlated with a decrease in FEV1 of approximately 13 ml in males and 5 ml in females. The same increase in weight correlated with a decrease in FVC of approximately 21 ml in males and 6.5 ml in females. The greater change in FVC and FEV1 in males than females has been attributed to the fact that males tend to accumulate extra weight primarily in the abdomen.

The notion that abdominal weight has a disproportionate effect on lung function is seconded to some extent by studies that have shown that decreases in FVC and FEV1 correlated better with increases in waist circumference and the waist to hip ratio than with BMI. One study showed a 1 cm increase in waist circumference caused a 13 ml reduction in FVC and an 11 ml reduction in FEV1 across a range of elevated BMI’s.

Continue reading

When an Inspiratory Volume really isn’t inspiring

I always like it when a patient does something during a test that makes me have to think about the basics of the test and what effect an error will have on the results. I was reviewing a report that had come across my desk and the technician performing the test had put “poor DLCO test reproducibility, fair quality in selected test” in the notes so of course I had to pull up the raw test data and take a look for myself.

The patient had performed three DLCO tests, two of which were completely unusable and one that was sort of okay but not really. Interestingly, the test system software thought it met the criteria for acceptability.

DLCO_Inspired_volume

The ATS/ERS statement on DLCO testing says that the inspired volume needs to be at least 85% of the patient’s largest known vital capacity. Even though the patient’s inspired volume during most of the test was well below this threshold they made a further inspiratory effort just before exhaling and exceeded the threshold when they did. For this reason the software thought the effort was acceptable. This points out limitations in our testing system software, its hardware, and in the ATS/ERS statement as well.

Continue reading

DMCO, Vc and 1/theta

Roughton and Forester’s seminal paper from the 1950’s showed that DLCO was a function of two resistances: the alveolar-capillary membrane and the rate of CO uptake by red blood cells. This relationship is shown by:

Formula 1 DLCO conductances

Roughton and Forster also showed that the membrane diffusing capacity (DMCO) and pulmonary capillary blood volume (Vc) could be calculated by performing the DLCO test at different oxygen concentrations and then plotting the results.

Modifed from: Pulmonary Function Testing Guidelines and Controversies, Jack Clausen ed., page 166.

Modifed from: Pulmonary Function Testing Guidelines and Controversies, published 1982, Jack Clausen ed., page 166.

Since the 1950’s DMCO and Vc have been measured for research fairly often. I first performed this test around 30 years ago mostly because I was interested in the technical aspects. I’ve tried to keep current with the research using DMCO and Vc ever since and have come to realize that there are several important details with a significant effect on how this test is performed and calculated.

Continue reading

Single-breath DLCO Breath-holding time (BHT)

The single-breath DLCO maneuver can rightly be criticized as being an artificial maneuver that bears little resemblance to normal breathing. It is only by standardizing the maneuver that clinically relevant and reproducible results can be obtained. One important aspect of this standardization is the breath-holding period.

The single-breath DLCO maneuver begins with a subject exhaling to RV, followed by an inhalation of the test gas mixture to TLC and then a 10-second breath-holding period, ending with an exhalation during which a sample of alveolar air is collected. The initial choice of a 10-second breath-hold period was largely arbitrary and was selected in order to strike a balance between being a short enough period that for most patients to hold their breath, long enough to minimize the inspiratory and expiratory phases and long enough to allow for a sufficiently measurable amount of carbon monoxide to be taken up.

During the inspiratory phase of the DLCO maneuver, carbon monoxide uptake does not begin until the inhaled gas has passed both the test system’s and the subject’s anatomic dead space and reached the first functional alveolar-capillary unit. The full rate of carbon monoxide uptake will not occur until the diffusing gas mixture has reached all available alveolar-capillary units and these units have reached their maximum surface area. The rate of carbon monoxide uptake therefore increases throughout inhalation and reaches a maximum near TLC.

During the exhalation phase, carbon monoxide uptake continues even as the alveolar sample is being taken. For this reason the concentration of carbon monoxide at the beginning of the sampling period tends to be higher than at the end of the sampling period. The size of the washout volume and the alveolar sample volume, which to some extent determines how long a patient has to exhale before the acquisition of an alveolar sample is complete, will also have an effect on exhaled gas concentrations.

Because the point at which carbon monoxide uptake starts and the point at which it ends are to some degree indeterminate, several methods for standardizing the measurement of the single-breath DLCO breath-hold period have been developed. Of these, the Ogilvie method starts measuring the breath-hold period at the very beginning of inhalation and stops at the beginning of the alveolar sampling period. The Epidemiology Standardization Project (ESP) method, on the other hand, also stops at the beginning of the alveolar sampling period but instead starts measuring at 50 percent of the inhaled volume. Finally, the Jones-Meade method starts measuring at 30 percent of the inspiratory time and stops in the middle of the alveolar sampling period.

DLCO_03_03_BHT_Graph

Continue reading

DLO2/Qc, SaO2 and CPETs

There are a number of simple observations that can be made during a cardio-pulmonary exercise test (CPET) that can point you immediately in a specific diagnostic direction. Recently I was reminded of this while reviewing the CPET results on patient with a complicated medical history whose test had been requested as part of a pre-operative assessment.

Most patients that are candidates for cardio-thoracic surgery do not need to have a CPET and that’s because it is usually straightforward to determine who is high risk and who is low risk from other routine tests. When risk is hard to determine or equivocal, the cardio-thoracic surgeons will order a CPET. They are primarily interested in the VO2 max and Ve-VCO2 slope since there are a number of widely accepted pre-op assessment algorithms that use these values. Even if the CPET results indicate the patient is high risk, the test details can help determine whether there is anything that can be done to improve the patient’s odds.

The patient whose report I was reviewing had moderately severe airway obstruction (FEV1 57% of predicted), mild restriction (TLC 77% of predicted) and a moderate gas exchange defect (DLCO 51% of predicted). This would normally pre-dispose me to look for a pulmonary vascular or pulmonary mechanical exercise limitation but there was a single test value that told me the limitation was going to be cardiovascular instead. That test value was the SaO2 at peak exercise which was 99%.

Continue reading

Gas solubility and why it matters

I have been searching through Pulmonary Function videos on YouTube in order to find ones I thought would be useful for technician education. So far what I’ve found have been intended either for medical students or for patients and not, in my opinion, particularly suitable for training technicians. Lately I’ve been looking at videos about lung volumes and have seen a half dozen presenters describe lung volume subdivisions using the same graph we’ve come to know and love with varying degrees of effectiveness and obfuscation.

From "Standardisation of the measurements of lung volumes", pg 512

From “Standardisation of the measurements of lung volumes”, pg 512

In a discussion of helium dilution lung volume measurements one of the presenters made an interesting statement and that was that “helium does not pass the alveolar-capillary barrier which means it stays inside the lungs during the test”. This is wrong on multiple levels. First, the alveolar-capillary membrane evolved for gas exchange and does not discriminate against individual gases so there is no barrier. Second, the reason that gases can be used as tracer gases or as probes of pulmonary circulation has entirely to do with gas solubility. Third, since it was a university-sponsored video with other egregious errors (for example did you know that lung volumes are measured in ml/kg?) what the heck are they teaching their medical students?

Gases can and will be absorbed by blood and tissue. The quantity of gas that can be absorbed is determined by the gas’s solubility and the Bunsen solubility coefficient is a measure of how much gas is absorbed (usually in milliliters of gas per milliliter of liquid) when the gas is at 1 atmosphere of pressure. When there is a multi-gas mixture, the quantity of gas absorbed for individual gas is calculated by:

Gas Content Calculation

Continue reading

One more DLCO technique: DLCO measured during exhalation (Intrabreath DLCO)

There have been numerous criticisms of the single-breath DLCO technique, many of them quite valid. In particular, the standard equation for calculating DLCO makes no consideration for the inspiratory and expiratory phases of the maneuver when lung volume and the alveolar capillary surface area are changing. Some investigators have devised ways of correcting for inhalation and exhalation, however other investigators have sidestepped the issue entirely by showing that DLCO can instead be calculated from information acquired only during exhalation.

During exhalation, once the gas that exits the lung leaves the alveoli, diffusion ceases. Gas that exits the lung during the early part of exhalation will have had less time for CO to diffuse from the alveoli into the pulmonary capillaries and will have a higher concentration of carbon monoxide than will gas that exits later. Exhaled gas can therefore be considered to consist of a continuous set of alveolar gas samples, separated by time and the differences between these “samples” can be used to calculate DLCO.

Several techniques have been developed to calculate DLCOexh. What these techniques have in common is that they all use a relatively standard single-breath DLCO gas mixtures in conjunction with fast responding carbon monoxide and helium or methane gas analyzers. They also require the subject exhale slowly (approximately 0.5 L/sec) after inhaling the DLCO gas mixture to TLC. The primary differences between these techniques lies in the way DLCOexh is calculated.

DLCOexh – Point Sample Technique:

In the study of Newth et al [9] the carbon monoxide and helium gas concentrations were determined for the midpoint of each 10% decrement in lung volume from 20% to 80% of the subjects exhaled volume.

DLCO_04_02_exh_Graph1 

Continue reading

Selecting a DLCO test in order to show airway obstruction

When DLCO tests are performed my lab’s standard policy to average two or more results that meet the criteria for quality and reproducibility. It is not unusual for us to perform three DLCO tests and have all of them meet quality criteria but to have one test result that is higher than the other two. Unlike spirometry tests, bigger isn’t necessarily better for DLCO, so in a circumstance like this we will average the two closest results rather than choose the highest result. Even though the higher test results can come from a DLCO test with good quality, I think that reproducibility trumps this and that choosing by reproducibility gives us results that are more clinically reliable.

When I review spirometry results and either lung volumes or a DLCO test has also been performed, I will always check the Slow Vital Capacity(SVC) from the lung volumes and the Inspiratory Volume (Vinsp) from the DLCO test to see if they are larger than the reported Forced Vital Capacity. If either of them is I will manually re-calculate the FEV1/VC ratio to see if it indicates the presence of airway obstruction. This is in line with the ATS-ERS recommendations to use the largest Vital Capacity, regardless of the source, for the FEV1/VC ratio.

I have been reviewing the raw test data for all DLCO tests (as well as all the lung volume tests and regular spot checks on spirometry) performed in my lab for at least the last year. Since our software and hardware upgrade a year and a half ago we’ve found a number of problems that have significant effects on the DLCO test results. Depending on the problem they are capable of causing the results to be over- or under-estimated. All of the technicians performing the tests are now well aware of these problems and there haven’t been any problematic DLCO tests selected for a while. Nevertheless, I always check the raw data just to be sure.

Today, I ran across a report that looked quite straightforward. A set of spirometry and DLCO tests had been performed on a frequent-flier patient with pulmonary fibrosis. The patient has restrictive lung disease and lung volumes measured about a year ago were 64% of predicted. Even though the patient’s FVC has decreased since then there is no clinical reason to repeat the lung volume measurements. The results looked like this: 

  Observed: %Predicted: Predicted:
FVC (L): 2.28 51% 4.45
FEV1 (L): 1.64 51% 3.21
FEV1/FVC (%): 72 100% 72
DLCO ml/min/mmHg: 12.03 50% 24.23
Vinsp (L): 2.29    

Continue reading