CPET Test Interpretation, Part 4: Interpretation and Summary

After having gone through the descriptive checklists for ventilatory, gas exchange and circulatory limitations the reason(s) for a patient’s exercise limitation, if any, should be reasonably clear. However, one of the first questions that should be asked when reading an exercise test is what was the purpose of the test?

  • Maximum safe exercise capacity for Pulmonary Rehab?
  • Rule in/rule out exercise-induced bronchospasm?
  • Pre-operative assessment?
  • Dyspnea of uncertain etiology?
  • What is the primary limitation to exercise (pulmonary or cardiac)?
  • Is deconditioning suspected?

The interpretation and summary should address these concerns.

The descriptions checklist is the main groundwork for the actual interpretation and any abnormal findings there may signal the need for specific comments. The interpretation should start by indicating whether or not the patient’s exercise capacity was normal and then should indicate the presence or absence of any limitations.

What was the patient’s maximum exercise capacity (maximum VO2)?

  • >120% = Elevated
  • 80% to 120% = Normal
  • 60% to 79% = Mildly reduced
  • 40% to 59% = Moderately reduced
  • <40% = Severely reduced

Example: There was a {elevated | normal | mildly reduced | moderately reduced | severely reduced} exercise capacity as indicated by the maximum oxygen consumption of XX%.

Continue reading
CPET Test Interpretation, Part 3: Circulation

I would like to re-emphasize the importance of the descriptive part of CPET interpretation. At the very least consider it to be a checklist that should always be reviewed even when you think you know what the final interpretation is going to be.

After gas exchange, the next step in the flow of gases is circulation. The descriptive elements for assessing circulation are:

What was the maximum heart rate?

The maximum predicted heart rate is calculated from 220 – age.

A maximum heart rate above 85% of predicted indicates that there has been an adequate exercise test effort.

Example: The maximum heart rate was XX% of predicted {which indicates an adequate test effort}.

What was the heart rate reserve?

The heart rate reserve is (predicted heart rate – maximum heart rate). A heart rate reserve that is greater than 20% of the (predicted heart rate – resting heart rate) is elevated and may be an indication of either chronotropic incompetence or an inadequate test effort.

Note: A negative heart rate reserve will occur whenever a patient exceeds their predicted heart rate.

Example: The heart rate reserve is XX BPM which is {within normal limits | elevated}.

Continue reading

CPET Test Interpretation, Part 2: Gas Exchange

I would like to re-iterate the importance of the descriptive part of CPET interpretation. At the very least consider it to be a checklist that should always be reviewed even when you think you know what the final interpretation is going to be.

After ventilation, the next step in the flow of gases is gas exchange. The descriptive elements for assessing gas exchange are:

What was the maximum oxygen consumption (VO2)?

The maximum oxygen consumption is the prime indicator of exercise capacity. Predicted values should be based on patient height, age, weight and gender.

Note: There is actually a surprising limited number of reference equations for maximum VO2. The only one I’ve found that takes weight into consideration in a realistic manner is Wasserman’s algorithm. Some test systems do not offer this reference equation but I feel it is worthwhile for it to be calculated and used regardless. See appendix for the algorithm.

Note: The maximum VO2 does not necessarily occur at peak exercise (i.e. test termination). This can happen in various types of cardiac and vascular diseases but also because the patient may decrease the level of their exercise before the test is terminated.

  • Maximum VO2 > 120% of predicted = Elevated
  • Maximum VO2 = 80% to 119% of predicted = Normal
  • Maximum VO2 = 60% to 79% of predicted = Mild impairment
  • Maximum VO2 = 40% to 59% of predicted = Moderate impairment
  • Maximum VO2 < 40% of predicted = Severe impairment

Example: The maximum VO2 was X.XX LPM { which is {mildly | moderately | severely } decreased | within normal limits | elevated}.

Continue reading

CPET Test Interpretation, Part 1: Ventilatory response

I’ve always found interpreting CPET tests to be one of the more interesting (and enjoyable) things I’ve done. Interpreting a CPET test is both more difficult and easier than interpreting regular PFTs. More difficult because there are a lot more parameters involved and easier because determining test adequacy and the primary cause(s) of an exercise limitation tends to be clearer.

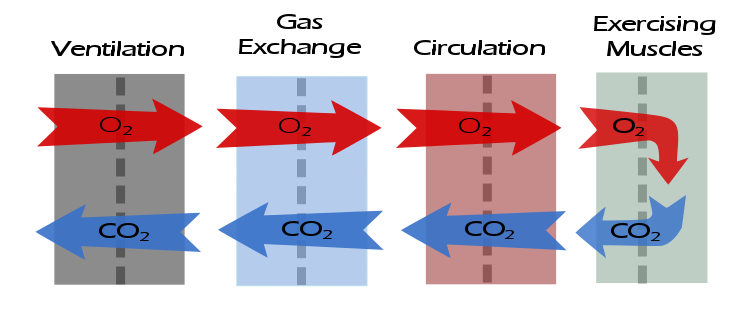
I’ve found that you have to go back to basic physiology whenever you interpret CPETs and that always boils down to the flow of oxygen and carbon dioxide.

Abnormalities in gas flow that occurs at any of these steps will leave a distinctive pattern in the test results. I’ve developed a structured approach to interpreting CPET results that includes a descriptive part as well as the interpretation and summary. The descriptive part may appear to be tedious but I’ve always found it to be absolutely critical to the actual interpretation.

The descriptive elements for assessing the ventilatory response to exercise are:

What was the baseline spirometry?

Note: Spirometry pre- and post-exercise should always be performed as part of a CPET, even when exercise-induced bronchoconstriction is not suspected. This is so that normal values for the ventilatory response to exercise can be determined.

Example: The FVC was {normal | mildly reduced | moderately reduced | moderately severely reduced | very severely reduced}. The FEV1 was {normal | mildly reduced | moderately reduced | moderately severely reduced | very severely reduced}. The FEV1/FVC ratio was was {normal | mildly reduced | moderately reduced | severely reduced}.

What was the post-exercise change in FEV1?

A decrease in FEV1 ≧ 15% following exercise is abnormal and suggests exercise-induced bronchoconstriction.

Note: FEV1 can increase post-exercise and an increase up to 5% is normal. Some patients with reactive airway disease bronchodilate with exercise and can an increase ≧ 15% from baseline, particularly if they were obstructed to begin with. Although strictly speaking this is not abnormal, it does suggest the presence of labile airways.

Example: There was {a significant decrease / no significant change / a significant increase} in FEV1 following exercise.

Continue reading

Contraindications

A couple weeks ago I was asked whether it was safe for a patient with an abdominal aortic aneurysm (AAA) to have pulmonary function testing. My first thought was that it was probably unsafe but after a moment or two of thought I realized that I hadn’t reviewed the subject for a long time. When I checked the 2005 ATS/ERS general testing guidelines (there are no contraindications in the 2005 spirometry guidelines) I found that AAA wasn’t mentioned at all. In fact, the only absolute contraindication mentioned was that patients with a recent myocardial infarction (<1 month) should not be tested. Some relative contraindications were mentioned:

  • chest or abdominal pain
  • oral or facial pain
  • stress incontinence
  • dementia or confusional state

and activities that should be avoided prior to testing include:

  • smoking within 1 hour of testing
  • consuming alcohol within 4 hours of testing
  • performing vigorous exercise within 30 minutes of testing
  • wearing clothing that restricts the chest or abdomen
  • eating a large meal with 2 hours of testing

but these were factors where test results were likely to be suboptimal and not actually contraindications.

This got me curious since I thought that pulmonary function testing was contraindicated for more conditions than just an MI. I reviewed the 1994 and and then the 1987 ATS statements on spirometry but again found no mention of contraindications. Ditto on the 1993 ERS statement on spirometry and lung volumes. Finally, in the 1996 AARC clinical guidelines for spirometry I found a much longer list of contraindications:

  • hemoptysis of unknown origin
  • pneumothorax
  • recent mycardial infarction
  • recent pulmonary embolus
  • thoracic, abdominal or cerebral aneuysms
  • recent eye surgery
  • presence of an acute disease process that might interfere with test performance (e.g. nausea, vomiting)
  • recent surgery of thorax or abdomen

So where did the AARC’s list of contraindications come from? And why is there such a discrepancy between the ATS/ERS and the AARC guidelines?

Continue reading

The effects of anemia on exercise

Last week I was reviewing the exercise test results from a patient that appeared to have a relatively straightforward cardiovascular limitation when I noticed the patient also had severe anemia (Hgb = 7.1). Once that fact came up it was no longer clear the patient actually had a cardiac limitation at all.

First the results:

Rest: %Predicted: AT: %Predicted: Max: %Predicted:
VO2 (LPM): 0.33 13% 0.73 28% 1.45 56%
VO2 (ml/kg/min): 5.0 11.0 21.6
VCO2 (LPM) 0.26 0.63 1.81
RER: 0.73 0.83 1.24
SaO2: 98% 97% 97%
PetCO2: 35.2 38.6 31.8
Ve/VO2: 34 26 43
Ve/VCO2: 47 31 35
Ve (LPM): 11.6 8% 19.2 13% 62.9 44%
Vt (L): 0.78 1.29 2.19
RR: 15 15 29
HR (BPM): 61 35% 92 52% 152 85%
BP (mmHg): 92/62 102/64
O2 Pulse (ml/beat): 5.8 39% 8.2 55% 9.8 66%

Continue reading

What does an inverse I:E Ratio during exercise mean?

Inspiration and expiration usually take different lengths of time, with inspiration almost always being shorter than exhalation. This is due to both to the physiology of breathing and to the pathophysiology of disease processes. During incremental exercise testing there are usually patterns to the way that inspiratory and expiratory times change and these are occasionally diagnostic.

When I started in this field the relationship between inspiratory and expiratory time was usually expressed as the I:E ratio, which was most often written as something like 1:1.2. One of my medical directors pointed out to me that when talking about I:E ratio it was difficult to determine what you meant if you said it was increasing or decreasing. For this reason I started reporting the I:E ratio as the E/I ratio so that instead of 1:1.2 it’s just 1.2.

Somewhere along the way however, for exercise testing at least, the most common way of expressing the I:E ratio seems to have morphed primarily into Ti/TTot (which is the Inspiratory Time/Total Inspiratory and Expiratory Time ratio), less commonly as Ti/Te and almost never as I:E. Even so, I still prefer the E/I ratio approach, partly because I’m used to it but mostly because it emphasizes the expiratory time component. For example:

Ti/TTot: Ti/Te: E/I:
0.50 1.00 1.0
0.48 0.91 1.1
0.45 0.83 1.2
0.43 0.77 1.3
0.42 0.71 1.4
0.40 0.66 1.5
0.38 0.63 1.6
0.37 0.59 1.7
0.36 0.56 1.8
0.34 0.53 1.9
0.33 0.50 2.0

Anyway, at rest most subjects breathe with an E/I ratio somewhere between 1.2 and 1.5 (Ti/TTot 0.45 – 0.40). During exercise the E/I ratio usually decreases more or less steadily and usually reaches 1.0 (Ti/TTot 0.50) at or near peak exercise. When a subject has airway obstruction the E/I ratio often doesn’t decrease and in those with severe airway obstruction it often increases instead. E/I ratios above 2.0 aren’t all that uncommon in subjects with COPD. Occasionally a subject with normal baseline spirometry (i.e. a normal FEV1/FVC ratio) has an elevated and/or increasing E/I ratio throughout testing and this is a clue that they probably have some degree of airway obstruction that’s not otherwise evident, and possibly even EIA if it increases at peak exercise.

Continue reading

Why DIY CPET reports?

When I first started performing CPETs in the 1970’s a patient’s exhaled gas was collected at intervals during the test in Douglas bags and I had a worksheet that I’d use to record the patient’s respiratory rate, heart rate and SaO2. After the test was over I’d analyze the gas concentrations with a mass spectrometer and the gas volumes with a 300 liter Tissot spirometer and then use the results from these to hand calculate VO2, VCO2, Rq, tidal volume and minute volume. These results were then passed on to the lab’s medical director who’d use them when dictating a report.

Around 1990 the PFT lab I was in at the time acquired a metabolic cart for CPET testing. This both decreased the amount of work I had to do to perform a CPET and significantly increased the amount of information we got from a test. The reporting software that came with the metabolic cart however, was very simplistic and neither the lab’s medical director or I felt it met our needs so I created a word processing template, manually transcribed the results from the CPET system printouts and used it to report results.

Twenty five years and 3 metabolic carts later I’m still using a word processing template to report CPET results.

Why?

Well, first the reporting software is still simplistic and using it we still can’t get a report that we think meets our needs (and it’s also not easy to create and modify reports which is a chronic complaint I have about all PFT lab software I’ve ever worked with). Second, there are some values that we think are important that the CPET system’s reporting software does not calculate and there is no easy way to get it on a report as part of the tabular results. Finally, and most importantly, I need to check the results for accuracy.

You’d think that after all these years that you wouldn’t need to check PFT and CPET reports for mathematical errors but unfortunately that’s not true. For example, these results are taken from a recent CPET:

Time: VO2 (LPM): VCO2 (LPM): Reported Rq: “Real” Rq:
Baseline: 0.296 0.220 0.74 0.74
00:30 0.302 0.214 0.77 0.71
01:00 0.363 0.277 0.77 0.76
01:30 0.395 0.306 0.78 0.77
02:00 0.424 0.353 0.99 0.83
02:30 0.459 0.403 0.92 0.88
03:00 0.675 0.594 0.89 0.88
03:30 0.618 0.584 0.94 0.94
04:00 0.836 0.822 1.00 0.98

Continue reading

When hypoventilation is the primary CPET limitation

Hypoventilation is defined as ventilation below that which is needed to maintain adequate gas exchange. It can be a feature in lung diseases as diverse as chronic bronchitis and pulmonary fibrosis but determining whether it is present of not is often complicated by defects in gas exchange. When desaturation occurs during a CPET (i.e. a significant decrease in SaO2 below 95%) this is a strong indication that the primary exercise limitation is pulmonary in nature and from that point the maximum minute ventilation and the Ve-VCO2 slope can show whether the limitation is ventilatory or instead due to a gas exchange defect. But in this circumstance what what does it mean when both the maximum minute ventilation and Ve-VCO2 slope are normal?

Recently a CPET came across my desk for an individual with chronic SOB. The individual recently had a full panel of pulmonary function tests:

Observed: %Predicted:
FVC (L): 1.73 62%
FEV1 (L): 1.39 66%
FEV1/FVC: 80 106%
TLC (L): 2.99 62%
DLCO (ml/min/mmHg): 14.66 84%
DL/VA: 5.45 124%
MIP (cm H2O): 11.5 18%
MEP(cm H2O): 21.3 24%

The reduced TLC showed a mild restrictive defect. At the same time the relatively normal DLCO indicates that the restriction is probably not due to interstitial lung disease and more likely either a chest wall or a neuromuscular disorder, both of which can prevent the thorax from expanding completely but where the lung tissue remains normal. The reduced MIP and MEP tends to suggest that a neuromuscular disorder is the more likely of the two.

I take this with a grain of salt however, and that is because this individual never had pulmonary function tests before and for this reason there is no way to know what their baseline DLCO was prior to the restriction. At the same time far too many individuals perform the MIP/MEP test poorly and low results are not definitive, and in this case in particular the results are so low the individual should have been in the ER, not the PFT Lab.

The CPET results were somewhat complicated, in that a close inspection showed both pulmonary and cardiovascular limitations.
Continue reading

Exercise and the IC, EELV and Vt/IC ratio

Determining whether a subject has a ventilatory limitation to exercise used to be fairly simple since it was based solely on the maximum minute ventilation (Ve) as a percent of predicted. There has been some mild controversy about how the predicted maximum ventilation is derived (FEV1 x 35, FEV1 x 40 or measured MVV) but these don’t affect the overall approach. Several decades ago however, it was realized that subjects with COPD tended to hyperinflate when their ventilation increased and that this hyperinflation could act to limit their maximum ventilation at levels below that predicted by minute ventilation alone.

The fact that FRC could change during exercise was hypothesized by numerous investigators but the ability to measure FRC under these conditions is technically difficult and this led to somewhat contradictory results. About 25 years ago it was realized that it wasn’t necessary to measure FRC, just the change in FRC and that this could be done with an Inspiratory Capacity (IC) measurement.

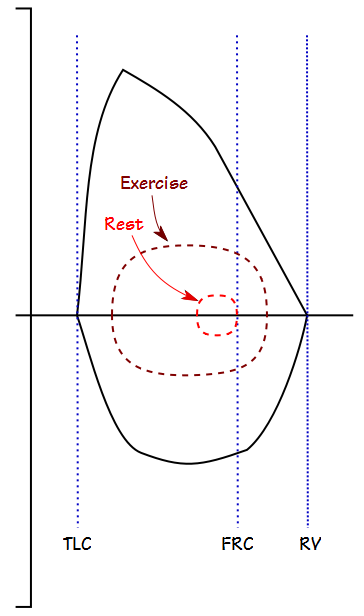
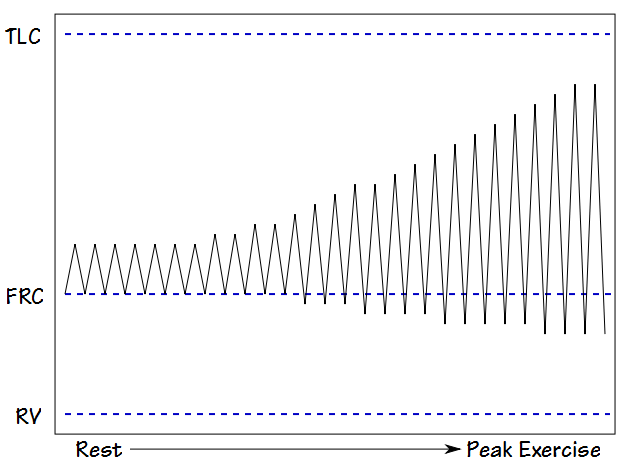
The maximum ventilatory capacity for any given individual is generally limited by their maximum flow-volume loop envelope. When a person with normal lungs exercises both their tidal volume and their inspiratory and expiratory flow rates increase.

Exercise_FVL_Normal

Exercise_VT_Normal

Continue reading