Inspiration and expiration usually take different lengths of time, with inspiration almost always being shorter than exhalation. This is due to both to the physiology of breathing and to the pathophysiology of disease processes. During incremental exercise testing there are usually patterns to the way that inspiratory and expiratory times change and these are occasionally diagnostic.
When I started in this field the relationship between inspiratory and expiratory time was usually expressed as the I:E ratio, which was most often written as something like 1:1.2. One of my medical directors pointed out to me that when talking about I:E ratio it was difficult to determine what you meant if you said it was increasing or decreasing. For this reason I started reporting the I:E ratio as the E/I ratio so that instead of 1:1.2 it’s just 1.2.
Somewhere along the way however, for exercise testing at least, the most common way of expressing the I:E ratio seems to have morphed primarily into Ti/TTot (which is the Inspiratory Time/Total Inspiratory and Expiratory Time ratio), less commonly as Ti/Te and almost never as I:E. Even so, I still prefer the E/I ratio approach, partly because I’m used to it but mostly because it emphasizes the expiratory time component. For example:
| Ti/TTot: | Ti/Te: | E/I: |
| 0.50 | 1.00 | 1.0 |
| 0.48 | 0.91 | 1.1 |
| 0.45 | 0.83 | 1.2 |
| 0.43 | 0.77 | 1.3 |
| 0.42 | 0.71 | 1.4 |
| 0.40 | 0.66 | 1.5 |
| 0.38 | 0.63 | 1.6 |
| 0.37 | 0.59 | 1.7 |
| 0.36 | 0.56 | 1.8 |
| 0.34 | 0.53 | 1.9 |
| 0.33 | 0.50 | 2.0 |
Anyway, at rest most subjects breathe with an E/I ratio somewhere between 1.2 and 1.5 (Ti/TTot 0.45 – 0.40). During exercise the E/I ratio usually decreases more or less steadily and usually reaches 1.0 (Ti/TTot 0.50) at or near peak exercise. When a subject has airway obstruction the E/I ratio often doesn’t decrease and in those with severe airway obstruction it often increases instead. E/I ratios above 2.0 aren’t all that uncommon in subjects with COPD. Occasionally a subject with normal baseline spirometry (i.e. a normal FEV1/FVC ratio) has an elevated and/or increasing E/I ratio throughout testing and this is a clue that they probably have some degree of airway obstruction that’s not otherwise evident, and possibly even EIA if it increases at peak exercise.
Despite the fact that the I:E ratio often reflects underlying lung disorders, I could find no mention of the I:E ratio (or Ti/TTot) in the 2003 ATS/ACCP statement on exercise testing, the 2010 AHA guide to exercise testing, the 2012 EACPR/AHA Joint statement on cardiopulmonary exercise testing, Wasserman et al’s textbook on exercise testing or in Madama’s textbook. Ti/TTot was mentioned in one paragraph of the 1997 ERS statement on exercise testing and twice in Ward and Palange’s 2007 monograph on exercise testing where Ti/TTot was dismissed by saying “this measurement is not commonplace in clinical exercise testing and its diagnostic value is not proven.”
Even so, when reviewing CPET results I always look at the progression of E/I ratio during exercise to see if it fits the other findings. The E/I ratio is almost always above 1.0 and only very rarely do I ever see it below 1.0 (which rightly or wrongly is what I call an inverse I:E ratio). When I do, most often it is during the baseline and most often in subjects that are hyperventilating (most likely anxiety or the fight-or-flight response). Once in a while I also see it dip slightly below 1.0 (like to around 0.95) at peak exercise, usually in relatively normal subjects. Other than that, E/I ratios below 1.0 (Ti/TTot > 0.50) are fairly unusual.
So, you can imagine I was interested when a CPET came across my desk with an E/I ratio below 1.0 throughout testing.
| Time: | Ve (L): | Vt (L): | RR: | Ti/TTot: | E/I: |
| 0:30 | 16.2 | 0.87 | 20 | 0.52 | 0.94 |
| 1:00 | 17.2 | 1.04 | 16 | 0.52 | 0.94 |
| 1:30 | 16.7 | 0.86 | 20 | 0.55 | 0.82 |
| 2:00 | 19.5 | 1.05 | 20 | 0.56 | 0.80 |
| 2:30 | 18.5 | 1.04 | 18 | 0.57 | 0.74 |
| 3:00 | 22.1 | 1.07 | 22 | 0.53 | 0.90 |
| 3:30 | 29.5 | 1.16 | 27 | 0.51 | 0.97 |
| 4:00 | 34.0 | 1.28 | 27 | 0.53 | 0.88 |
| 4:30 | 38.4 | 1.33 | 34 | 0.56 | 0.78 |
| 5:00 | 48.5 | 1.49 | 33 | 0.55 | 0.82 |
| 5:30 | 59.6 | 1.55 | 39 | 0.55 | 0.82 |
The individual in question has IPF and was referred for the CPET as part of a pre-operative assessment by CT surgery.
| Observed: | %Predicted: | |
| FVC: | 3.24 | 79% |
| FEV1: | 2.54 | 87% |
| FEV1/FVC: | 78 | 108% |
| DLCO: | 11.32 | 47% |
| VA: | 3.67 | 55% |
Despite the subject’s reduced DLCO, the primary limitation turned out to be cardiovascular which was apparent because they never desaturated (SaO2 remained above 95% throughout testing); the VO2 at AT was reduced (39% of predicted); the Ve-VCO2 slope (rest to peak) was elevated (43.6); and the chronotropic index was reduced (0.76) without being on beta-blockers. The subject was also well below a ventilatory limitation (max Ve 59% of predicted) at peak exercise.
I’d say that chronotropic incompetence (usually because of beta blocker medications but not always) is one of the more common diagnoses we see in our CPETs, so other than the reduced E/I ratio there wasn’t anything terribly unusual about the CPET.
So why was the E/I ratio reduced?
As already mentioned this can happen during the baseline period, usually when an individual is hyperventilating but this almost always disappears and the E/I ratio reverts to more normal values within a minute or so after exercise starts. When it persists during exercise however, it’s most often a sign of inspiratory airway obstruction. This can be due to a variety of causes, which can include vocal cord dysfunction, but the primary sign that this is occurring is that there is an inspiratory plateau in the flow-volume loops (we obtain these when we have subjects perform an inspiratory capacity maneuver in order to measure changes in their EELV). In this case however, this didn’t appear to be happening,
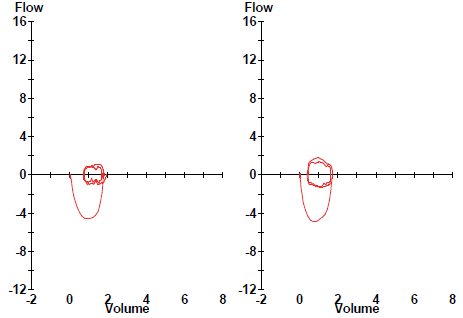
Inspiratory loops from the last two exercise levels
The subject’s peak inspiratory flow was more than -4.0 L/sec and there was no apparent plateau whatsoever. There really aren’t any normal values available for peak inspiratory flow during exercise, but this really doesn’t look like there’s any significant inspiratory flow limitation.
This individual does has IPF however, and for this reason I searched the literature as best as I could looking for any association between interstitial diseases and inverse I:E ratios. What I found was that the I:E ratio or Ti/TTot are only rarely reported in studies of ILD and exercise. Where it is reported however, the majority indicate that the I:E ratio and/or Ti/TTot usually were not significantly different from normal subjects or that there were actually small decreases in Ti/TTot (small increases in E/I ratio).
Even though there doesn’t appear to be a general association between IPF and an inverse I:E ratio I have to wonder there may be one in this case. IPF causes lungs to become “stiffer” and harder to expand which should increase the work of breathing during inspiration. As part of the pre-CPET assessment we always record breath sounds and for this patient they were “loud inspiratory crackles”. Although inspiratory crackles (particularly “velcro” crackles) are often seen (well, heard actually) in IPF, their cause is unclear. In chronic bronchitis however, they are an indication that small atelectatic airways are popping open and since atelectasis is often seen in IPF I’m going to go out on a limb as say that the cause of inspiratory crackles in IPF is probably similar. If that’s the case, then opening atelectatic airways has to increase the inspiratory work of breathing even more.
This is going a long way around to say that my best guess is that this subject’s inverse I:E ratio is occurring because their inspiratory work of breathing is much higher than it is for expiration, and that this is causing them to have a slower inspiration than expiration. If we could measure compliance it might be possible to show that this is the case but we don’t have the ability to do this (and I don’t know of any clinical PFT Labs that does) so given the lack of any apparent inspiratory obstruction, other than an elevated inspiratory work of breathing it’s hard to imagine what else the cause could be.
The I:E ratio (or Ti/TTot) is an often overlooked measurement in cardiopulmonary exercise testing. Realistically it only rarely adds something to the diagnostic interpretation, but it still should always be reviewed and this is because unexpectedly elevated E/I ratios (reduced Ti/TTot) can show that there is a component of expiratory airway obstruction in subjects with normal spirometry and reduced E/I ratios (elevated Ti/TTot) can show the presence of inspiratory airway obstruction.
The E/I ratio is usually mildly elevated at rest and decreases to 1.0 at peak exercise in normal subjects. An E/I ratio slightly below 1.0 at rest or at peak exercise isn’t all that unusual but an E/I ratio that remains below 1.0 (or a Ti/TTot that remains above 0.50) throughout testing is unusual and deserves further investigation. In this particular instance an inverse I:E ratio, although interesting, didn’t really contribute to the final diagnosis, which was a cardiovascular limitation. If the reason(s) for the cardiovascular limitation can be addressed and the CPET repeated however, it’s possible the patient would reach a ventilatory limitation instead, in which case the inverse I:E ratio might end up playing a role after all.
References:
ATS/ACCP statement on cardiopulmonary exercise testing. Am J Respir Crit Care Med 2003; 167: 211-277.
Balady GJ, Arena R, Sistema K, et al. Clinicians guide to cardiopulmonary exercise testing in adults: A scientific statement from the American Heart Association. Circ 2010; 122: 191-225.
Burdon JGW, Killian KJ, Jones NL. Pattern of breathing during exercise in patients with interstitial lung disease. Thorax 1983; 38: 778-784.
EACPR/AHA Joint Statement. Clinical recommendations for cardiopulmonary exercise testing data assessment in specific patient populations. Eur Heart J 2012; 33: 2917-2927.
ERS Task Force. Clinical exercise testing with reference to lung diseases: indications, standardization and interpretation strategies. Eur Respir J 1997; 10: 2662-2689.
Evans CH, White RD Editors. Exercise testing for primary care and sports medicine physicians. Springer Science and Business Media. Published 2009.
Harris-Eze AO, Sridhar G, Clemens RE, Zintel TA, Gallagher CG, Marciniuk DD. The role of hypoxia and pulmonary mechanics in exercise limitation in interstitial lung disease. Am J Respir Crit Care Med 1996; 154: 994-1001.
Madama VC. Pulmonary function testing and cardiopulmonary stress testing. Second edition. Delmar Publishers. 1998.
Markovitz GH, Cooper CB. Exercise and interstitial lung disease. Current Opinion in Pulmonary Disease 1998; 4: 272-280.
Ward SA, Palange P. Clincal Exercise Testing. European Respiratory Monography 40, June 2007.
Wasserman K, Hansen JE, Sue DY, Stringer WW, Whipp BJ. Principles of exercise testing and interpretation, Fourth Edition. Lipincott, Williams & Wilkins. Published 2005.

PFT Blog by Richard Johnston is licensed under a Creative Commons Attribution-NonCommercial 4.0 International License