Getting more out of the LCI with Scond and Sacin

The Lung Clearance Index (LCI) is a relatively simple test that provides a measure of ventilation inhomogeneity within the lung. This can be clinically useful information since several studies have shown that increases in LCI often precede decreases in FEV1 in cystic fibrosis and post-lung transplant. LCI results are only a general index into ventilation inhomegeneity however, and other than showing its presence, does not give any further information about its cause or location.

There is additional information that can be derived from an LCI test that can indicate the general anatomic location where ventilation inhomegeneity (or alternatively, ventilation heterogeneity) is occurring; specifically the conducting or acinar airways. This can be done because changes in the slope of the tidal N2 washout waveform during an LCI test are sensitive to the conduction-diffusion wavefront in the terminal bronchioles. Careful analysis of these slopes permits the derivation of two indexes; Scond, an index of the ventilation heterogeneity in the conducting airways; and Sacin, an index of ventilation heterogeneity the acinar airways.

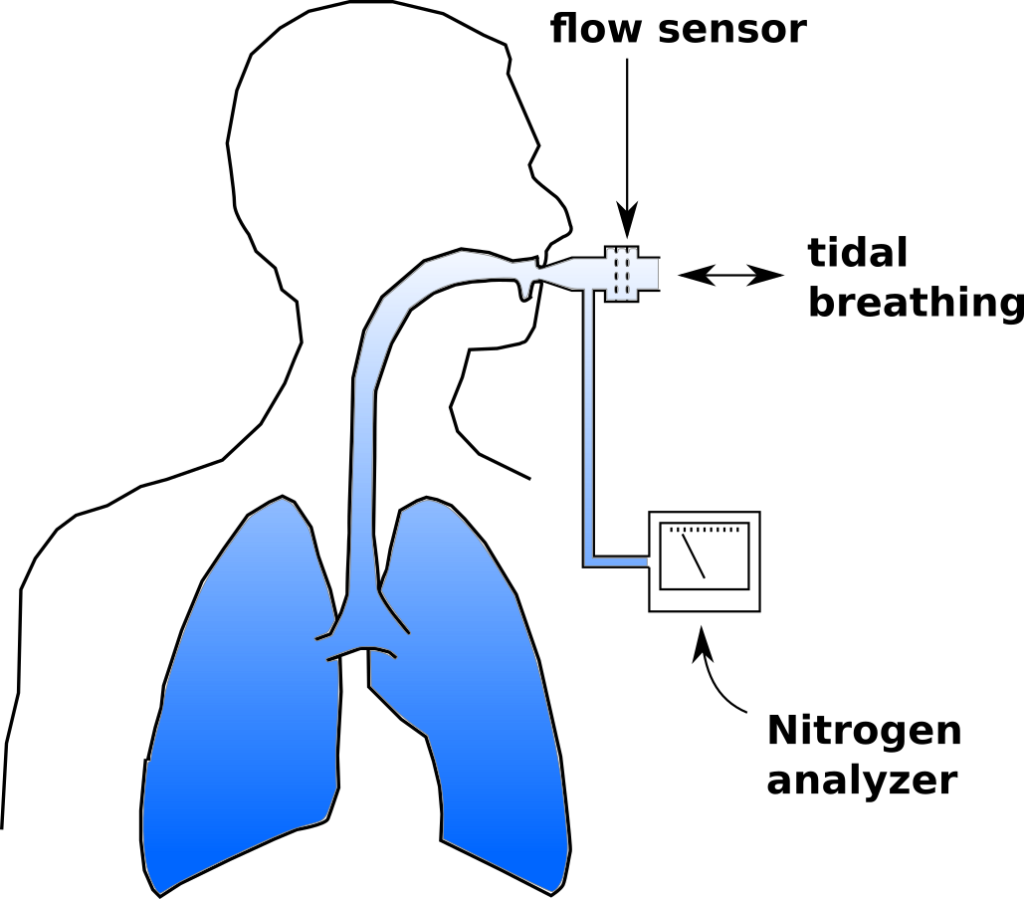
To review, an LCI test is a multi-breath nitrogen washout test. An individual is switched into a breathing circuit with 100% O2.

Once this happens tidal volume is measured continuously and used to determine the cumulative exhaled volume. Exhaled nitrogen is also measured continuously and is used to determine the cumulative exhaled nitrogen volume. The LCI test continues until the end-tidal N2 concentration is 1/40th of what is was initially (nominally 2%). At that point FRC is calculated using the cumulative exhaled nitrogen volume:
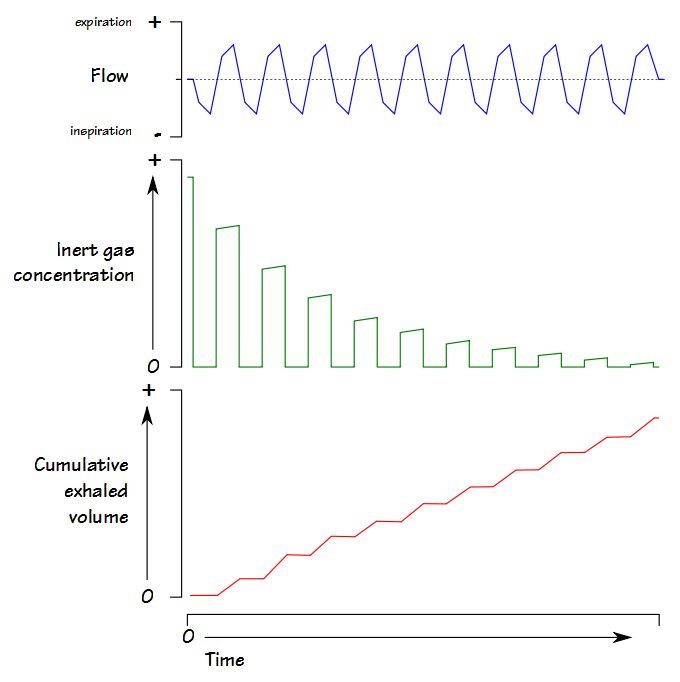
FRC (L) = Exhaled N2 Volume / (Initial N2 Concentration – Final N2 concentration)

LCI is calculated by:

LCI = Cumulative Exhaled Volume (L) / FRC (L)

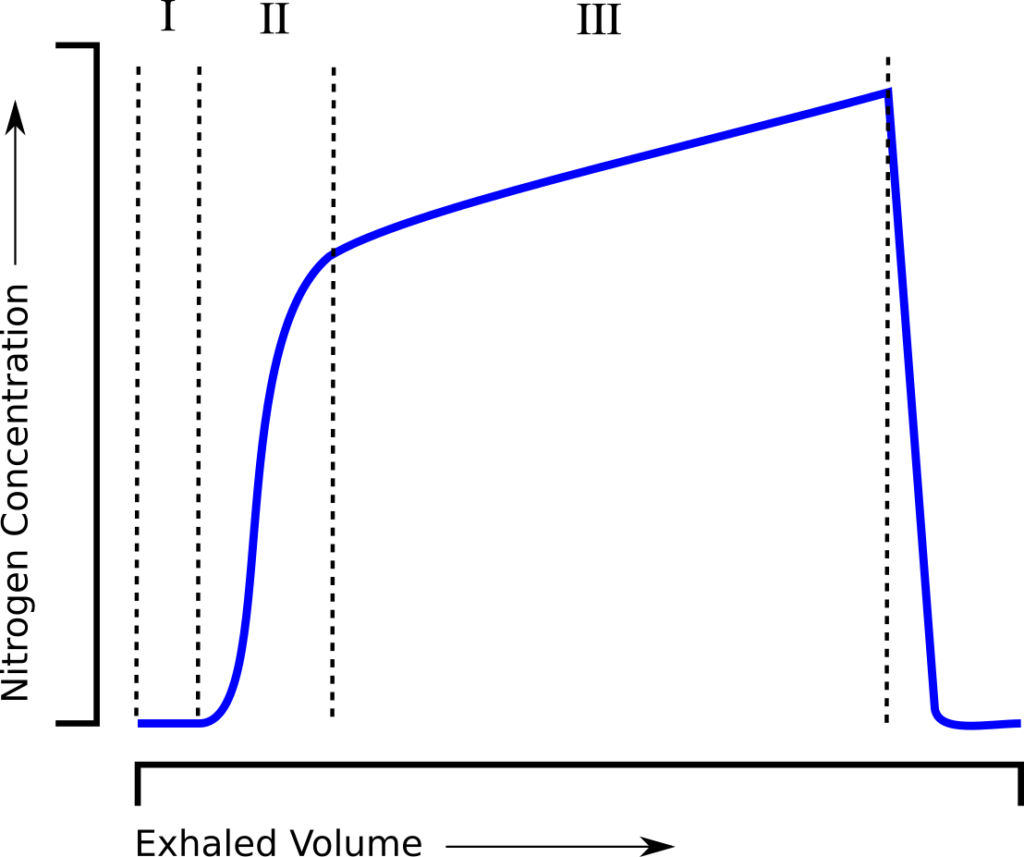
and is essentially a measure of how much ventilation is required to clear the FRC. When an individual tidal breath from the LCI test is graphed, it looks similar to a standard single-breath N2 washout:

and can be similarly subdivided into phase I (dead space washout), phase II (transition) and phase III (alveolar gas).

Continue reading

Vocal cord dysfunction

Recently I reviewed a set of completely irreproducible spirometry results. The patient had made eight attempts and the FVC, FEV1 and Peak Flow were different every time. In particular, there were frequent stops and starts during exhalation. I’ve always wondered why some patients have so much difficulty with what should be a simple test and although in this particular case it could simply be glottal closure I wondered if it could be Vocal Cord Dysfunction (VCD). For this reason I spent some time reviewing the literature.

Vocal Cord Dysfunction is defined as the paradoxical closure of the vocal cords with variable airflow obstruction that often mimics asthma and in fact VCD is often mistaken for refractory asthma. Unfortunately, for this reason individuals with VCD are often treated with corticosteroids and bronchodilators for years without any improvement of their symptoms.

The gold standard for diagnosing VCD is direct visualization of the vocal cords with a laryngoscope. Characteristically, the anterior (frontal) two-thirds of the vocal cords are closed with a narrow posterior glottal chink. The difficulty with this is that VCD symptoms are often transitory and a large number of patients that are suspected to have VCD are asymptomatic when a laryngoscopy is performed.

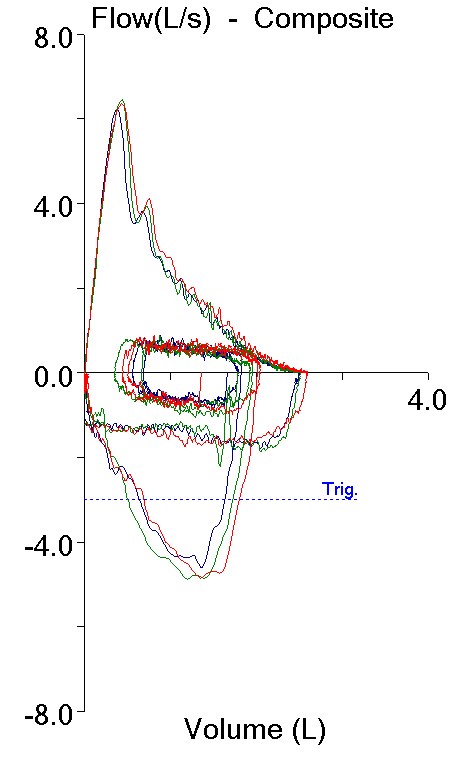
Since most PFT labs are not equipped with laryngoscopes nor are they prepared to perform a laryngoscopy at a moment’s notice we have to rely on the tests that measure airflow. Although the wheeze and shortness of breath that accompanies VCD mimics asthma the most common problem associated with VCD is inspiratory obstruction. The flow-volume loop pattern is therefore that of a variable extrathoracic airway obstruction.

VCD_FVL

Continue reading

The effects of Obesity on lung function

Obesity has become far more commonplace than it was a generation ago. The reasons for this are unclear and have been attributed at one time or another to hormone-mimicking chemicals in our environment, altered gut biomes, sedentary lifestyles or the easy availability of high calorie foods. Whatever the cause, obesity affects lung function through a variety of mechanisms although not always in a predictable manner.

Spirometry:

Many investigators have shown a relatively linear relationship between an increase in BMI and decreases in FVC and FEV1. These decreases are small however, and FVC and FEV1 tend to remain within normal limits even in extreme obesity. The decreases in FEV1 and FVC tend to be symmetrical which is shown by the fact that the FEV1/FVC ratio is usually preserved in obese subjects without lung disease. Several studies have shown that the decreases in FVC and FEV1 are reversible since a decrease in weight showed a corresponding increase in FVC and FEV1.

In one study a 1 kg increase in weight correlated with a decrease in FEV1 of approximately 13 ml in males and 5 ml in females. The same increase in weight correlated with a decrease in FVC of approximately 21 ml in males and 6.5 ml in females. The greater change in FVC and FEV1 in males than females has been attributed to the fact that males tend to accumulate extra weight primarily in the abdomen.

The notion that abdominal weight has a disproportionate effect on lung function is seconded to some extent by studies that have shown that decreases in FVC and FEV1 correlated better with increases in waist circumference and the waist to hip ratio than with BMI. One study showed a 1 cm increase in waist circumference caused a 13 ml reduction in FVC and an 11 ml reduction in FEV1 across a range of elevated BMI’s.

Continue reading

What does it mean when Ve exceeds its predicted during a CPET?

When I review the results from a CPET I am used to considering a maximum minute ventilation (Ve) greater than 85% of predicted as an indication of a pulmonary mechanical limitation. Recently a CPET report came across my desk with a maximum minute ventilation that was 142% of predicted. How is this possible and does it indicate a pulmonary mechanical limitation or not?

It is unusual to see a Ve that is greater than 100% of predicted. We derive our predicted max Ve from baseline spirometry and calculate it using FEV1 x 40. We have tried performing pre-exercise MVV tests in the past and using the maximum observed MVV as the predicted maximum Ve but our experience with this has been poor. Patients often have difficulty performing the MVV test correctly and realistically even if it is performed well the breathing maneuver used during an MVV test is not the same as what occurs during exercise. Since both Wasserman and the ATS/ACCP statement on cardiopulmonary exercise testing recommend the use of FEV1 x 35 or FEV1 x 40 as the predicted maximum minute ventilation we no longer use the MVV.

There are usually only two situations where a patient’s exercise Ve is greater than their predicted max Ve. First, when a patient is severely obstructed their FEV1 is quite low and FEV1 x 40 may underestimate what they are capable of since they are occasionally able to reach a Ve a couple of liters per minute higher than we expected. Second, if the FEV1 is underestimated due to poor test quality then the predicted max Ve will also be underestimated. In this case however, the baseline spirometry had good quality, was repeatable and the results did not show severe obstruction but instead looked more like mild restriction.

Pre_Exercise_FVLs

Effort 1: Effort 2: Effort 3:
FVC (L): 2.51 2.52 2.60
FEV1 (L): 1.86 1.87 1.95
FEV1/FVC %: 74 74 75
PEF: 6.26 6.46 6.37

Continue reading

Exhaled air temperature and Asthma

One of the hallmarks of chronic asthma is airway inflammation. This frequently causes an increase in the perfusion of the airways which in turn can appear as an increased DLCO in routine PFTs. A number of investigators have noted that this inflammation can also cause an increase in exhaled air temperature. This increase in exhaled air temperature is not due to an increase in body temperature but to increase in the rate of heat exchange between the airways and respired air due to the increased airway perfusion.

Because the increase in exhaled air temperature also correlates reasonably well with exhaled Nitric Oxide (NO) levels it would seem that measuring exhaled air temperature as part of spirometry or other pulmonary function testing could either act as a substitute for exhaled NO measurements or at least indicate which patients would benefit the most from exhaled NO measurements. It turns out however, that making these measurements is a lot more complicated than it would appear at first glance.

The most important factor that makes exhaled temperature difficult to measure is that it varies throughout exhalation. This has lead to two different approaches to measuring exhaled air temperature. First by measuring the rate at which exhaled air temperature changes during a slow exhalation. Second, by measuring the plateau temperature (PLET) which usually occurs near the end of exhalation and also usually from a slow, controlled exhalation.

Continue reading