Oscillometry

A month or two ago in the AARC Diagnostics forum several members noted that their labs had acquired Impulse Oscillometry systems a number of years ago but that their physicians had since stopped ordering oscillometry tests, mostly because nobody understood what it was measuring and didn’t know how to interpret the results. There are a number of reasons why this is probably not an uncommon scenario and why, despite being first described in 1956, oscillometry is not used more widely.

But first, what is oscillometry, and what’s the best way to understand it?

Oscillometry refers to a closely related group of techniques for measuring respiratory impedance by superimposing small pressure waves on top of normal tidal breathing.

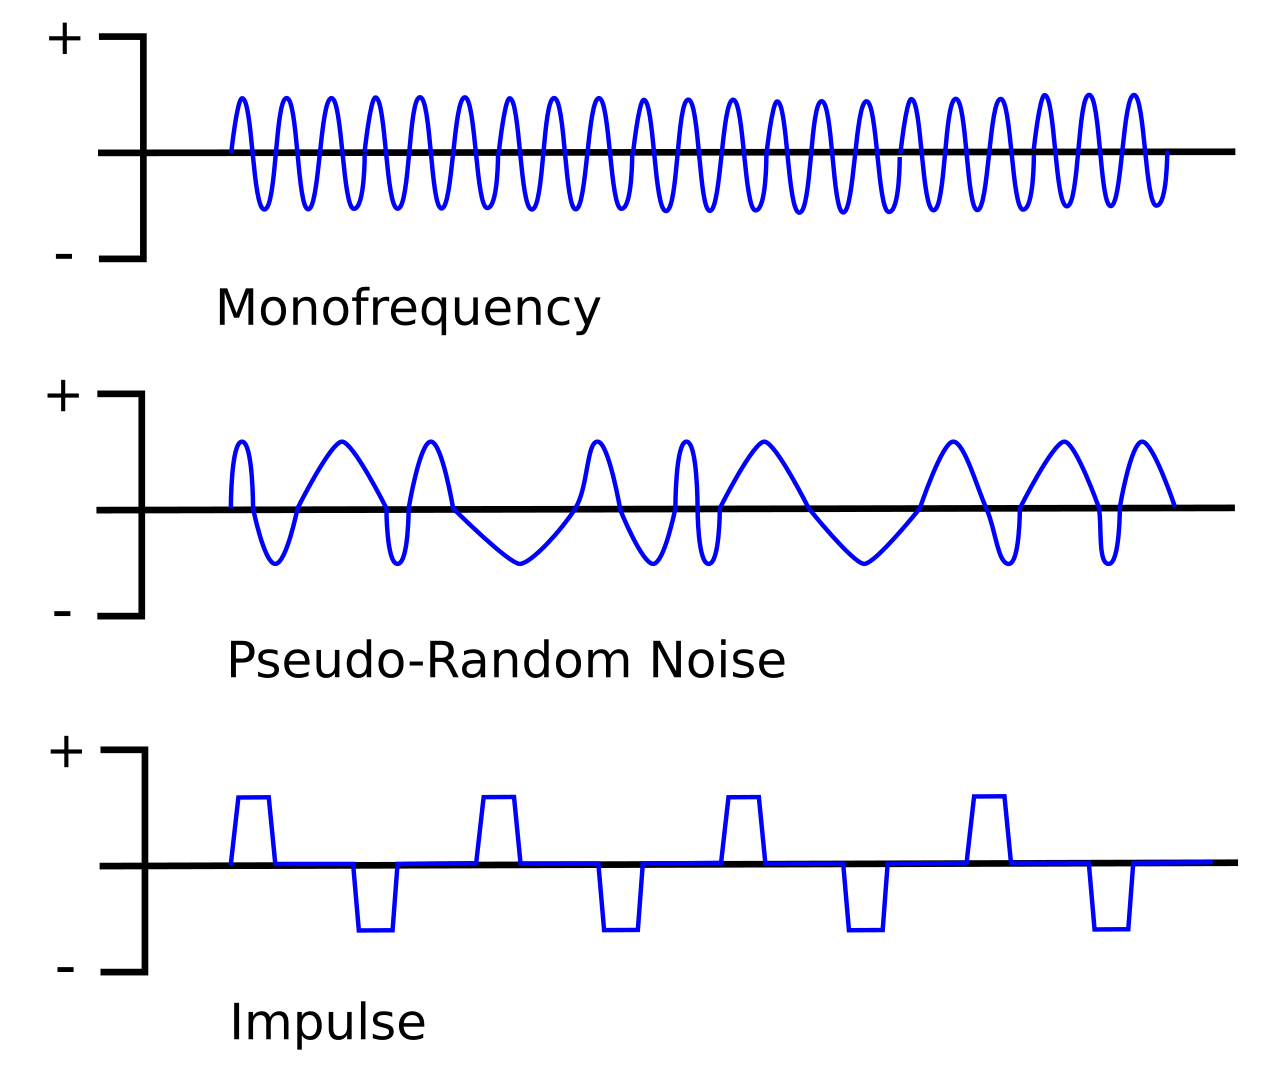
There are three main approaches: the Forced Oscillation Technique (FOT), which is sometimes used a blanket term for all oscillometry techniques but more often refers to a single frequency technique, Impulse Oscillometry (IOS) and Pseudo-Random Noise (PRN). Most commercial oscillometry systems use either PRN or IOS because each approach uses multiple oscillation frequencies more or less simultaneously which allows testing to performed relatively quickly. The mono-frequency technique is used mostly in research because although it is slow to scan all frequencies, it is able to resolve rapid changes occurring at a single frequency.

All techniques share a similar equipment configuration:

The oscillatory pressure is usually generated by a loudspeaker, although the actual waveform and the frequency it produces differ for each technique. The peak pressures are usually on the order of +/- 1 to 5 cm H2O (+/- 0.1 to 0.5 kPa). Because patients have to breathe during testing, the system provides a steady flow of fresh air in one manner or another but this has to include a low pass filter of some kind so that the pressure waveform is not significantly diverted or blunted. The key measurements are flow and the pressure at the mouth.
Continue reading

Eye was fooled

A couple of days ago I was reviewing (triaging, actually) the spirometry portion of a full panel of PFTs performed with pretty terrible test quality and was trying to decide if the technician responsible for performing the tests had made the right selections from the patient’s test results. I noticed that the FEV1 that had been selected was actually the lowest FEV1 from the all the spirometry efforts the patient made, and was trying to decide whether this was really the correct choice. We use peak flow to help determine which FEV1 to select and that particular spirometry effort appeared to have the highest and sharpest peak flow by a large margin:

particularly when compared to the other spirometry efforts:

But this was hard to reconcile given how low the FEV1 was relative to the others:

Test #1 Test #2 Test #3
Observed: %Predicted: Observed: %Predicted: Observed: %Predicted:
FVC (L): 1.71 41% 2.46 59% 2.39 58%
FEV1 (L): 1.24 39% 1.81 57% 1.77 55%
FEV1/FVC: 73 95% 74 96% 74 97%

Continue reading

PFTs on YouTube

A friend recently sent me the links to several YouTube videos on pulmonary function testing. I’ve spent some time off and on over the last year looking at YouTube videos and in particular I’ve been looking for ones that can be used as part of technician education. Maybe I’ve set the bar too high but all too often I’ve been disappointed and frustrated with what I’ve found. One reason for this is that many videos are aimed at other audiences than technicians (i.e. medical students, physicians, patients). Another reason is that too often only simple concepts are presented, often in rote fashion and often without good visual explanations (c’mon, these are videos after all, not podcasts). A final reason is that sometimes they’re outdated, misleading or just plain wrong.

Still, even the flawed videos can be useful. Sometimes this is because they occasionally explain some concepts well; sometimes despite being simplistic they present a good overview; and sometimes because their mistakes can serve as points for discussion. I’ve tried to select videos that have at least some potential for use in technician education.

John B. West Respiratory Physiology Lectures

Based primarily on his classic textbook, ‘Respiratory Physiology’ (which should be on everybody’s bookshelf). Not 100% perfect but this is what many of the other videos should aspire to be. Many complex concepts explained using simple examples. Lots of interesting pictures and illustrations. Should be part of every technician’s education.

  1. Structure and Function
  2. Ventilation
  3. Blood Gas Transport
  4. Acid-Base Balance
  5. Diffusion
  6. Pulmonary Blood Flow
  7. Pulmonary Gas Exchange, Part 1
  8. Pulmonary Gas Exchange, Part 2
  9. Mechanics of Breathing, Part 1
  10. Mechanics of Breathing, Part 2
  11. Control of Ventilation
  12. Defense Systems of the Lung
  13. Respiration under Stress
  14. Respiration at the Limit

Continue reading

Z Score to remember is -1.645

The use of Z scores to report PFT results, both clinically and for research is occurring more and more frequently. Both the Z score and the Lower Limit of Normal (LLN) come from the same roots and in that sense can be said to be saying much the same thing. The difference between the two however, is in the emphasis each places on how results are analyzed. The LLN primarily emphasizes only whether a result is normal or abnormal. The Z score is instead a description of how far a result is from the mean value and therefore emphasizes the probability that a result is normal or abnormal.

Reference equations are developed from population studies and the measurements that come from these studies almost always fall into what’s called a normal distribution (also known as a bell-shaped curve).

A normal distribution has two important properties: the mean value and the standard deviation. The mean value is essentially the average of the results while the standard deviation describes whether the distribution of results around the mean is narrow or broad.

The simple definition of the Z score for a particular result is that it is the number of standard deviations that a result is away from the mean. It is calculated as:

Continue reading

Contraindications

A couple weeks ago I was asked whether it was safe for a patient with an abdominal aortic aneurysm (AAA) to have pulmonary function testing. My first thought was that it was probably unsafe but after a moment or two of thought I realized that I hadn’t reviewed the subject for a long time. When I checked the 2005 ATS/ERS general testing guidelines (there are no contraindications in the 2005 spirometry guidelines) I found that AAA wasn’t mentioned at all. In fact, the only absolute contraindication mentioned was that patients with a recent myocardial infarction (<1 month) should not be tested. Some relative contraindications were mentioned:

  • chest or abdominal pain
  • oral or facial pain
  • stress incontinence
  • dementia or confusional state

and activities that should be avoided prior to testing include:

  • smoking within 1 hour of testing
  • consuming alcohol within 4 hours of testing
  • performing vigorous exercise within 30 minutes of testing
  • wearing clothing that restricts the chest or abdomen
  • eating a large meal with 2 hours of testing

but these were factors where test results were likely to be suboptimal and not actually contraindications.

This got me curious since I thought that pulmonary function testing was contraindicated for more conditions than just an MI. I reviewed the 1994 and and then the 1987 ATS statements on spirometry but again found no mention of contraindications. Ditto on the 1993 ERS statement on spirometry and lung volumes. Finally, in the 1996 AARC clinical guidelines for spirometry I found a much longer list of contraindications:

  • hemoptysis of unknown origin
  • pneumothorax
  • recent mycardial infarction
  • recent pulmonary embolus
  • thoracic, abdominal or cerebral aneuysms
  • recent eye surgery
  • presence of an acute disease process that might interfere with test performance (e.g. nausea, vomiting)
  • recent surgery of thorax or abdomen

So where did the AARC’s list of contraindications come from? And why is there such a discrepancy between the ATS/ERS and the AARC guidelines?

Continue reading

Assessing post-BD improvement in FEV1 and FVC as a percent of the predicted

The 2005 ATS/ERS standards for assessing post-bronchodilator changes in FVC and FEV1 have been criticized numerous times. A recent article in the May issue of Chest (Quanjer et al) has taken it to task on two specific points:

  • the change in FVC and FEV1 has to be at least 200 ml
  • the change is assessed based on the percent change (≥12%) from the baseline value

The article points out that the 200 ml minimum change requires a proportionally larger change for a positive bronchodilator response in the short and the elderly. Additionally, by basing the post-BD change on the baseline value it lowers the threshold (in terms of an absolute change) for a positive bronchodilator response as airway obstruction become more severe. As a way of mitigating these problems the article recommends looking at the post-bronchodilator change as a percent of predicted rather than as a percent of baseline.

The article is notable (and its authors are to be commended) because it studied 31,528 pre- and post-spirometry records from both clinical and epidemiological sources from around the world. For the post-bronchodilator FEV1 and FVC:

  • the actual change in L
  • the percent change from baseline
  • the change in percentage of predicted
  • the Z-score

were determined.

Continue reading

What do you do when the predicted is zero?

A very strange spirometry report came across my desk a couple of days ago.

Observed: Predicted: %Predicted:
FVC: 3.07 0 29767
FEV1: 2.15 0 37586
FEV1/FVC: 70 71 101%

My first thought was that some of the demographics information had been entered incorrectly but when I checked the patient’s age, height, gender and race all were present, all were reasonably within the normal range for human beings in general and more importantly, all agreed with what was in the hospital’s database for the patient. I tried changing the patient’s height, age, race and gender to see if it would make a difference and although this made small changes in the percent predicted when I did this the predicteds were still zero.

Or were they? They actually couldn’t have been zero, regardless of what was showing up on the report, since the observed test values are divided by the predicted values and if the predicted were really zero, then we’d have gotten a “divide by zero” error, and that wasn’t happening. Instead the predicted values had to be very close to zero, but not actually zero, and the software was rounding the value down to zero for the report. Simple math showed me the predicted value for FVC was (very) approximately 0.0103 liters, but why was this happening?

Continue reading

The effects of anemia on exercise

Last week I was reviewing the exercise test results from a patient that appeared to have a relatively straightforward cardiovascular limitation when I noticed the patient also had severe anemia (Hgb = 7.1). Once that fact came up it was no longer clear the patient actually had a cardiac limitation at all.

First the results:

Rest: %Predicted: AT: %Predicted: Max: %Predicted:
VO2 (LPM): 0.33 13% 0.73 28% 1.45 56%
VO2 (ml/kg/min): 5.0 11.0 21.6
VCO2 (LPM) 0.26 0.63 1.81
RER: 0.73 0.83 1.24
SaO2: 98% 97% 97%
PetCO2: 35.2 38.6 31.8
Ve/VO2: 34 26 43
Ve/VCO2: 47 31 35
Ve (LPM): 11.6 8% 19.2 13% 62.9 44%
Vt (L): 0.78 1.29 2.19
RR: 15 15 29
HR (BPM): 61 35% 92 52% 152 85%
BP (mmHg): 92/62 102/64
O2 Pulse (ml/beat): 5.8 39% 8.2 55% 9.8 66%

Continue reading

Is there such a thing as a normal decrease when the FEV1 isn’t normal?

I’ve mentioned before that my lab’s database goes back to 1990, so we now have 27 years of test results available for trending. At least a couple times a week we have a patient who was last seen 10 or even 20 years ago. When I review their results I try to see if there has been any significant change from their last tests. Since the last tests are often quite some time in the past the changes in an absolute sense are often noticeably large. The question then becomes whether or not these changes are normal.

Although the ATS/ERS, NIOSH and ACOEM standards for spirometry address changes over time they don’t specifically discuss changes over a decade or longer. Instead, without indicating a time period (other than saying a year or more), the concensus is that a change greater than 15% in age-adjusted FVC or FEV1 is likely to be significant. A change in absolute values greater than:

Or if the current FEV1 is less than:

Then the change is likely significant.

This sounds fairly reasonable and although we could quibble about the importance of how quickly or slowly this age-adjusted 15% change occurs and how well it applies when the patient’s latest age is beyond the reference equation’s study population (we have a fair number of 90+ year old patients nowadays) or when it’s across a developmental threshold (adolescent to adult), it’s still a good starting point.

I’ve been more or less following these rules for the last several years, when the results for a patient whose last test was 18 years ago came across my desk. The FEV1 from the current spirometry was 71% of predicted and the FEV1 from 18 years ago was 70% of predicted. Strictly speaking the absolute change was about -15% (the FEV1 was 2.06 L in 1999 and 1.76 L in 2017, a 0.30 L change) but when adjusted for the change in age, that’s only 40% what a significant change would need to be:

Given that the FEV1 percent predicted from both the older and newer test were essentially identical I automatically started to type “The change in FEV1 is normal for the change in age” when it suddenly occurred to me that neither FEV1 was normal in the first place so how could I be sure the change be normal?

Continue reading

What does an inverse I:E Ratio during exercise mean?

Inspiration and expiration usually take different lengths of time, with inspiration almost always being shorter than exhalation. This is due to both to the physiology of breathing and to the pathophysiology of disease processes. During incremental exercise testing there are usually patterns to the way that inspiratory and expiratory times change and these are occasionally diagnostic.

When I started in this field the relationship between inspiratory and expiratory time was usually expressed as the I:E ratio, which was most often written as something like 1:1.2. One of my medical directors pointed out to me that when talking about I:E ratio it was difficult to determine what you meant if you said it was increasing or decreasing. For this reason I started reporting the I:E ratio as the E/I ratio so that instead of 1:1.2 it’s just 1.2.

Somewhere along the way however, for exercise testing at least, the most common way of expressing the I:E ratio seems to have morphed primarily into Ti/TTot (which is the Inspiratory Time/Total Inspiratory and Expiratory Time ratio), less commonly as Ti/Te and almost never as I:E. Even so, I still prefer the E/I ratio approach, partly because I’m used to it but mostly because it emphasizes the expiratory time component. For example:

Ti/TTot: Ti/Te: E/I:
0.50 1.00 1.0
0.48 0.91 1.1
0.45 0.83 1.2
0.43 0.77 1.3
0.42 0.71 1.4
0.40 0.66 1.5
0.38 0.63 1.6
0.37 0.59 1.7
0.36 0.56 1.8
0.34 0.53 1.9
0.33 0.50 2.0

Anyway, at rest most subjects breathe with an E/I ratio somewhere between 1.2 and 1.5 (Ti/TTot 0.45 – 0.40). During exercise the E/I ratio usually decreases more or less steadily and usually reaches 1.0 (Ti/TTot 0.50) at or near peak exercise. When a subject has airway obstruction the E/I ratio often doesn’t decrease and in those with severe airway obstruction it often increases instead. E/I ratios above 2.0 aren’t all that uncommon in subjects with COPD. Occasionally a subject with normal baseline spirometry (i.e. a normal FEV1/FVC ratio) has an elevated and/or increasing E/I ratio throughout testing and this is a clue that they probably have some degree of airway obstruction that’s not otherwise evident, and possibly even EIA if it increases at peak exercise.

Continue reading