2017 ATS PFT Reporting Standardization

The ATS has released its first standard for reporting pulmonary function results. This report is in the December 1, 2017 issue of the American Journal of Respiratory and Critical Care Medicine. At the present time however, despite its importance it is not an open access article and you must either be a member of the ATS or pay a fee ($25) in order to access it. Hopefully, it will soon be included with the other open access ATS/ERS standards.

There are a number of interesting recommendations made in the standard that supersede or refine recommendations made in prior ATS/ERS standards, or are otherwise presented for the first time. Specific recommendations include (although not necessarily in the order they were discussed within the standard):

  • The lower limit of normal, where available, should be reported for all test results.
  • The Z-score, where available, should be reported for all test results. A linear graphical display for this is recommended for spirometry and DLCO results.
  • Results should be reported in tables, with individual results in rows. The result’s numerical value, LLN, Z-score and percent predicted are reported in columns, in that recommended order. Reporting the predicted value is discouraged.

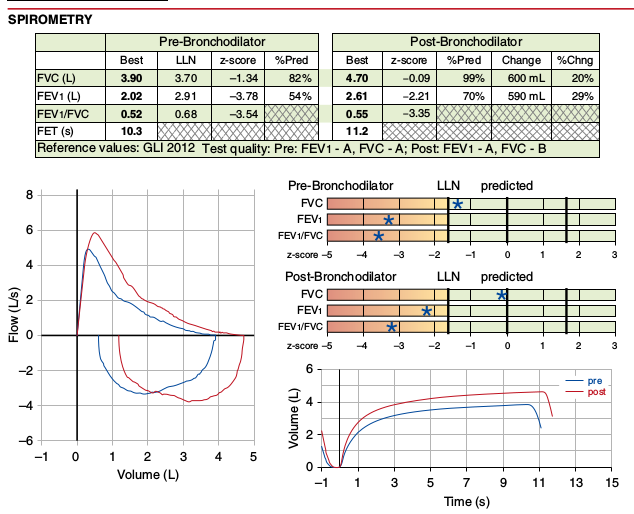
Part of Figure 1 from page 1466 of the ATS Recommendations for a Standardized Pulmonary Function Report.

Continue reading

Making Assumptions about TGV and FRC

When lung volumes are measured in a plethysmograph the actual measurement is called the Thoracic Gas Volume (TGV). This is the volume of air in the lung at the time the shutter closes and the subject performs a panting maneuver. Ideally, the TGV measurement should be made at end-exhalation and should be approximately equal to the Functional Residual Capacity (FRC). For any number of reasons in both manual and automated systems this doesn’t happen and the point at which the TGV is measured is either above or below the FRC.

Testing software usually corrects for the difference in TGV and FRC by determining the end-exhalation baseline that is present during the tidal breathing at the beginning of the test. Using this value the software can determine where the TGV was measured relative to the tidal breathing FRC and then either subtracts or adds a correction factor to derive the actual FRC volume.

One problem with this is that leaks in either the subject or the mouthpiece and valve manifold can occur during the panting maneuver and the end-exhalation baseline can shift and this will affect the calculation of RV and TLC. I’ve discussed this previously and as a reminder, RV is calculated from:

RV = [average FRC] – [average ERV]

where the FRC is determined from the corrected TGV and ERV is determined from SVC maneuvers. TLC is then calculated from:

TLC = RV + [largest SVC]

When the post-shutter FRC baseline shifts upwards (higher lung volumes relative to the pre-shutter FRC):

ERV is underestimated, which in turn causes both RV and TLC to be overestimated. When the post-shutter FRC baseline shifts downwards (lower lung volumes relative to the pre-shutter FRC):

ERV is overestimated, which in turn causes both RV and TLC to be underestimated.

I’ve been aware of this problem for quite a while and use this as a guideline when selecting the FRCs and SVCs from specific plethysmograph tests. All of these assumptions are based on the fact that FRC is derived from the pre-shutter end-exhalation tidal breathing. Well, you know what they say about assuming…

Continue reading

The effect of errors in Inspiratory Volume on DLCO.

Yesterday while reviewing reports I ran across an interesting error in the Inspiratory Volume (VI) from a DLCO test. I’ve probably seen this before but this time I realized what effect it could have on DLCO. Specifically, what I saw was that at the start of the DLCO test the subject had not finished exhaling and although the technician had started the test, the subject continued to exhale.

What makes this interesting is that the software used the subject’s volume at the start of the test as the initial volume. This means that the software measured the VI from the initial volume to the end of inspiration, not from the point at which the subject stopped exhaling to the end of inspiration. This also means that the VI was underestimated by 0.20 L and this affects both VA and the calculated DLCO.

Continue reading

DLCO, de-constructed

My wife watches the Food Network a lot and I occasionally watch it with her but I can only take so much of it before I go off and read or work on one of my projects. I’ve noticed however in the various cooking contests that sometimes a chef will deconstruct a familiar recipe. This more or less means they break the recipe down into its components and present them as separate pieces or perhaps by putting what goes inside on the outside instead.

I’ve discussed the DLCO test with numerous people and have found that many know and understand (or at least remember) the ATS/ERS criteria for test quality. At the same time however, there seems to be very few people that understand the formula used to calculate the single-breath DLCO and I suspect this is probably because most of us didn’t like the mathematics classes we had to attend in high school or college (and tried to forget what we learned as quickly as we could afterwards).

The DLCO formula isn’t that complicated however, and more importantly all the components of the DLCO test and the reasons for the ATS/ERS quality criteria are embedded within it. All this seems to be a good reason to de-construct the DLCO “recipe” and try to explain it’s various pieces.

As a reminder the single-breath DLCO formula is:

Where:

VA = alveolar volume in ml

BHT = breath holding time in seconds

Pb = barometric pressure

PH2O = partial pressure of water vapor in the lung

FITrace = fractional concentration of tracer gas in the inspired DLCO mixture

FATrace = fractional concentration of tracer gas in the alveolar sample

FICO = fractional concentration of CO in the inspired DLCO mixture

FACO = fractional concentration of CO in the alveolar sample

I think the part that bothers everybody the most is:

and that’s because there’s two different things going on here. First, the part within the brackets:

is intended to correct the initial CO concentration for the dilution that occurs when the DLCO test gas mixture is inhaled and mixes with the gas that was within the lung at the start of the inhalation. The whole point of the DLCO test is to measure CO uptake but the initial concentration for this measurement is not what’s in the tank, it’s what’s in the lungs after it has been diluted by the lung’s residual volume and deadspace gas.
Continue reading

COHb and Pulse Oximetry

I was reviewing a report recently that included the results for walking oximetry. These showed that the individual has a resting SaO2 of 97% and desaturated significantly to 86% after walking a couple hundred yards. This was curious since a DLCO had also been performed and the results for that test were 94% of predicted. It’s unusual for somebody with a normal DLCO to have that low of an SaO2 but I have seen it before in individuals who were unable to ventilate adequately because of a paralyzed diaphragm. I’ve also seen it happen sometimes when somebody has a peripheral vascular disease like Reynaud’s that produces a poor quality oximeter signal. Buried in the technician’s notes however, was an additional piece of information that called into question both the resting and the exercise SaO2 readings. Specifically, the notes mentioned that an ABG had been performed and that the subject’s COHb was 9%.

Oxygen saturation is measured spectrophotometrically. The different forms of hemoglobin, i.e. oxyhemoglobin (O2Hb), deoxyhemoglobin, methemoglobin (MetHb) and carboxyhemoglobin (COHb) absorb the frequencies of red and infrared light differently.

from Hampson NH. Pulse oximetry in severe carbon monoxide poisoning. Chest 1998; 114: 1036-1041

Although non-invasive oximetry was first developed during the 1930’s and 1940’s (in 1935 by K. Mathes in Germany and independently in 1942 by G. Milliken in the USA), current pulse oximeter technology dates from 1972 (by Takuo Aoyagi, researcher for Nihon Koden in Japan). The original pulse oximeters were large, bulky and generally stationary pieces of equipment. Oximeters underwent progressive miniaturization during the 1980’s and 1990’s and rapidly evolved into the handheld and fingertip units we see today and the only “stationary” oximeters that remain are those used in ICU-type monitoring systems.

Modern laboratory CO-oximeters measure the absorption of light in a blood sample at up to 128 wavelengths, spread across the entire hemoglobin absorption spectrum. Using mathematical analysis they can report total hemoglobin concentration and oxygen saturation in addition to fractional deoxyhemoglobin, COHb, and MetHb.

Continue reading

Why the FEV1/FVC ratio LLN as a percent of the predicted FEV1/FVC ratio is important

My medical director and I had a discussion today about where the cutoff for a normal FEV1/FVC ratio would be for a 93 year old patient of his. Part of the problem is that there are almost no reference equations for patients this age and the best you can usually do is to extrapolate. Another part is that anybody in their 90’s is a survivor and must have had good lung function throughout their life to reach that age, which means that they aren’t average so it’s not clear how well extrapolation actually works in this population. The final part is that the guidelines for PFT interpretation that are used by my lab were put into place about 40 years ago and reflect the thoughts at that time. I updated part of the guidelines with the 2005 ATS/ERS interpretation algorithm about 10 years ago, but the thresholds for normalcy (as well as the reference equations we use) still haven’t changed all that much. I’ve brought this issue up a number of times over the years (usually every time I get a new medical director) but haven’t gotten a consensus from the pulmonary physicians on either the need for change or for what threshold values should be used.

Anyway, both my medical director and I felt felt that the LLN for the FEV1/FVC ratio (when viewed as a percent of the predicted FEV1/FVC ratio) is probably lower for a 75 year old (and certainly for a 93 year old) than it is for a 25 year old, and that the current lab guidelines for interpretation were probably diagnosing airway obstruction in the elderly more often than they should. My lab currently uses the NHANESIII reference equations for spirometry however, and I wasn’t sure they showed this particularly well since the equations for the FEV1/FVC ratio and its LLN are quite simplistic compared to those for FVC and FEV1.

The NHANESIII reference equations were published in 1999 and at that time they were derived from the largest population that had ever been studied (7428 subjects, 40.9% male, 59.1% female) and with the most sophisticated statistical analysis that had been used up until that time. In 2012 however, the Global Lung Function Initiative (GLI) released a set of reference equations using data obtained from 73 centers world-wide on 97,759 subjects (44.7% male, 55.3% female). Statistical analysis of the GLI data was performed using the Lambda, Mu, Sigma (LMS) approach and a set of equations were derived that covered ages 3 to 95.

I have some reservations about how well the GLI equations match the population served by my lab but it’s a moot point whether I like them or not since even now, 5 years after the GLI equations were published, my lab’s software has not been updated to include them. The reason for this is that the GLI spirometry equations use what are called “splines” to generate the spirometry reference values and these are taken from a look-up table. My lab’s software does have an equation editor but it will not accommodate lookup tables so the GLI equations can’t be added. I’m sure our equipment manufacturer could get around this if they really wanted to, but so far it hasn’t happened.

I do have a lot of respect for the GLI equations however, and think that the overall view they give of the normal distribution of FVC, FEV1 and the FEV1/FVC ratio is far more correct than those of any prior studies. Using a spreadsheet tool downloaded from the GLI that lets me generate the GLI spirometry predicted values and the NHANESIII reference equations I decided to take a closer look at their predicted FEV1/FVC ratios and their LLNs.

Continue reading

What’s normal about the GLI DLCO reference values?

The Global Lung Initiative (GLI) has been working for several years to develop a universal reference equation for DLCO. Although this endeavor is not necessarily complete, an article describing the GLI DLCO reference equation for Caucasians was published in the September issue of the European Respiratory Journal as an open access article and can be downloaded by anyone. The Global Lung Initiative in general and the authors of the article more particularly are to be commended for this monumental work and for the insight it brings to understanding the normal distribution of DLCO.

The data used to develop the GLI reference equations was originally derived from 19 studies the GLI identified to have been performed on lifetime nonsmoking populations. 85% of the results came from Caucasian populations and the remaining from two Asian sources. The authors felt that there weren’t a sufficient number of non-Caucasians to accurately describe any ethnicity-based differences in DLCO and for this reason only the Caucasian data was used.

From this data some results were excluded because of:

  • FEV1 > 5 Z-scores or < 5 Z scores
  • Height (children only, >5 or <5 Z scores)
  • VA less than VC
  • Elevated BMI (>30 kg/m2 in adults, >85% centile in children)
  • Missing demographic information

After these exclusions 9710 results remained of which 4859 were male and 4851 were female. DLCO values were corrected for altitude and FiO2 and uncorrected for hemoglobin. Reference equations were derived using the LMS (Lambda, Mu, Sigma) method.

Note: The study population consisted of individuals from 4.5 to 91 years of age and GLI reference equations are valid across this entire span. The majority of the existing DLCO reference equations available to me are for an adult population and for this reason this discussion of the GLI DLCO reference equations will be limited to this portion of the age range. The GLI article also includes reference values for KCO and VA but these subjects will also be saved for a separate discussion.

Not surprisingly, DLCO is highest in tall and young individuals, and lower in short and elderly ones.

Continue reading

What’s wrong with an elevated DLCO?

Well, not necessarily anything, although as usual that depends on the circumstances. Recently I was contacted by an individual who was concerned that their DLCO had decreased from 120% of predicted to 99% of predicted. They also mentioned that their DLCO results have normally ranged from 117% to 140% of predicted over the last 9 months.

More interestingly however, they said that

“the technician told me before I even took the test that anything over 100% for DLCO is essentially a testing error.”

Wow. That statement is wrong on so many levels it’s hard to know where to start but I’ll give it a shot anyway.

First, there are a variety of DLCO reference equations. The ATS/ERS guidelines recommends that PFT Labs pick the reference values that most closely matches their patient population but how this is done is left to individual labs. There are at least a couple dozen DLCO reference equations to choose from and probably about a half dozen of these are in common use in PFT labs around the world.

Because no patient population is ever going to precisely match those of a study this means that DLCO results are going to tend to be above or below 100% of predicted depending on which reference equation the lab is actually using. This also means that if results from otherwise normal subjects are mostly above or mostly below 100% of predicted then the wrong reference equations are being used.

Continue reading

Should biological quality control be replaced?

I’ve been thinking about quality control and quality improvement lately. Mostly this has been about how to go about determining whether the lab has a quality problem with testing and what statistics should be used for this purpose but I was reminded recently about an issue concerning biological quality control that came up a couple months ago on the AARC diagnostics forum. Specifically, one of the participants noted that some of their technicians had refused to perform biological QC on the basis that it violated their HIPAA rights to the privacy of their medical information. Further discussion noted that this was actually a correct interpretation of the HIPAA regulations and that no PFT lab can “force” its technicians to perform biological QC.

I will be the first to admit that I’d never thought about it this way, and I’ve been mulling it over ever since. I’ve performed PFT testing on myself both for formal biological QC and as a quick way to check the operation of a test system for decades but I never thought of my PFT results as being part of my medical information. That’s probably an indication of my own short-sightedness however, and I also realize that over the years I’ve run across a number of testing issues I’d taken for granted up until somebody pointed out a problem with them.

My attitude towards my PFT results may also be due to the fact that I don’t have any notable lung disease. My lab has had technicians who have been asthmatic however, and this has never been a factor in whether they were hired or not (other than not letting them perform methacholine challenges). They’ve usually performed bio-QC on themselves and at the time they seemed to regard it as a way to check on the status of their asthma. In retrospect however, I have to wonder if they were ever concerned that I would use their health status and test information against them in their annual evaluation, or even that the hospital would re-consider their employment because the costs of their health insurance might be higher. Although I don’t think the hospitals I’ve worked for ever thought along these lines, like it or not there are many businesses where this is a factor.

Yesterday I asked myself what would happen if all PFT labs were required to completely end biological quality control because of HIPAA requirements? It didn’t take a lot of thought to realize that there are a number of mechanical test simulators in the marketplace that could do quite well at replacing the biological part of quality control. As importantly, the more I’ve thought about it the more I’ve come to think that biological QC probably isn’t the right way to go about QC in the first place.

Continue reading

Getting more out of the LCI with Scond and Sacin

The Lung Clearance Index (LCI) is a relatively simple test that provides a measure of ventilation inhomogeneity within the lung. This can be clinically useful information since several studies have shown that increases in LCI often precede decreases in FEV1 in cystic fibrosis and post-lung transplant. LCI results are only a general index into ventilation inhomegeneity however, and other than showing its presence, does not give any further information about its cause or location.

There is additional information that can be derived from an LCI test that can indicate the general anatomic location where ventilation inhomegeneity (or alternatively, ventilation heterogeneity) is occurring; specifically the conducting or acinar airways. This can be done because changes in the slope of the tidal N2 washout waveform during an LCI test are sensitive to the conduction-diffusion wavefront in the terminal bronchioles. Careful analysis of these slopes permits the derivation of two indexes; Scond, an index of the ventilation heterogeneity in the conducting airways; and Sacin, an index of ventilation heterogeneity the acinar airways.

To review, an LCI test is a multi-breath nitrogen washout test. An individual is switched into a breathing circuit with 100% O2.

Once this happens tidal volume is measured continuously and used to determine the cumulative exhaled volume. Exhaled nitrogen is also measured continuously and is used to determine the cumulative exhaled nitrogen volume. The LCI test continues until the end-tidal N2 concentration is 1/40th of what is was initially (nominally 2%). At that point FRC is calculated using the cumulative exhaled nitrogen volume:

FRC (L) = Exhaled N2 Volume / (Initial N2 Concentration – Final N2 concentration)

LCI is calculated by:

LCI = Cumulative Exhaled Volume (L) / FRC (L)

and is essentially a measure of how much ventilation is required to clear the FRC. When an individual tidal breath from the LCI test is graphed, it looks similar to a standard single-breath N2 washout:

and can be similarly subdivided into phase I (dead space washout), phase II (transition) and phase III (alveolar gas).

Continue reading