Flow-volume loops are timeless

Recently I’ve been trying to help somebody whose spirometry results changed drastically depending on where their tests were performed. When their spirometry was performed on an office spirometer their FVC was less than 60% of predicted and when they were performed in a PFT lab on a multi-purpose test system their FVC was closer to 90% of predicted. Part of the reason for this was that different predicted equations are being used in each location but even so there was about a 1.5 liter difference in FVC.

One important clue is that the reports from the office spirometer showed an expiratory time of around 2 to 2-1/2 seconds while the reports from the PFT lab showed expiratory times from 9 to 12 seconds. The reports from both locations however, only had flow-volume loops and reported expiratory time numerically. There were no volume-time curves so it isn’t possible to verify that the spirometry being performed at either location was measuring time correctly or to say much about test quality.

The shape of a flow-volume loop is often quite diagnostic and many lung disorders are associated with very distinct and specific contours. Volume-time curves, on the other hand, are very old-school and are the original way that spirometry was recorded. The contours of volume-time curves are not terribly diagnostic or distinctive and I suspect they are often included as a report option more because of tradition than any thing else. But volume-time curves are actually a critically important tool for assessing the quality of spirometry and one of the most important reasons for this is because there is no time in a flow-volume loop.

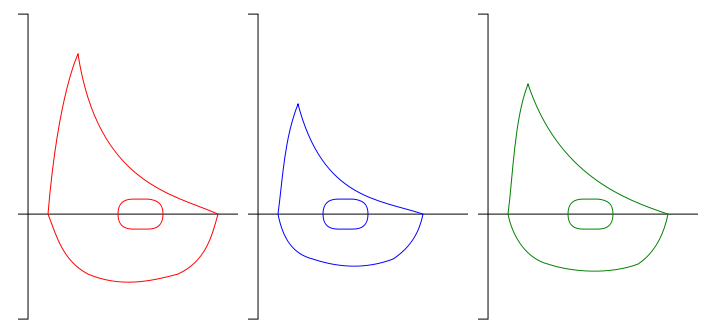
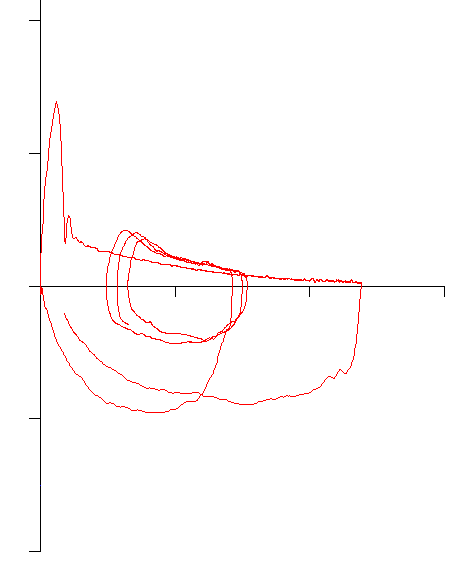
With this in mind, the following flow-volume loop came across my desk yesterday. The FVC, FEV1 and FEV1/FVC ratio were all normal and it was the best of the patient’s efforts.

fvl_timeless

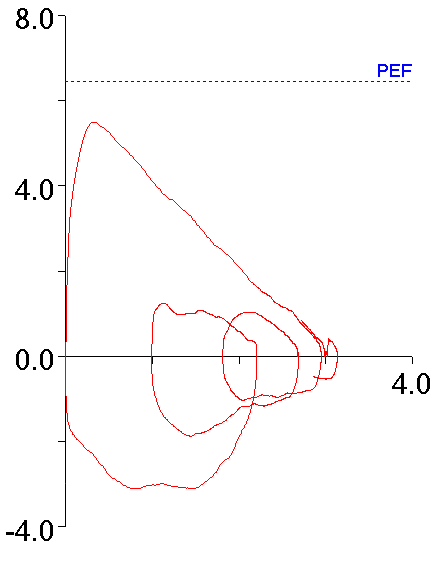
The contour of this flow-volume loop is actually reasonably normal, except possibly for the little blip at the end.
Continue reading

IC, ERV and the FVC

While reviewing reports today I ran across a couple of lung volume tests from different patients where the SVC was over a liter less than the FVC. Suboptimal SVC measurement can affect both the TLC and the RV and in one case the TLC was slightly below normal (78% of predicted) and in the other the TLC was within normal limits but the RV was over 150% of predicted. Both patients had had lung volume measurements previously and the current TLC was significantly different than it had been before.

I seem to run across this problem at least once a week so I am reasonably used to making manual corrections. I’ve discussed this previously but basically I use the position of the tidal loop within the maximal flow-volume loop obtained during spirometry to determine IC and ERV and then re-calculate TLC and RV accordingly.

fvl_tvl_4

Anyway, for this reason I had tidal loops, and IC and ERV on my mind while I was reviewing other reports. Shortly after this I came across a report that had “fair FVC test quality and reproducibility” in the tech notes so I pulled up the raw spirometry test data and took a closer look.

What I found was that the patient had performed five spirometry efforts and that the FVC and FEV1 was different on each test. All five spirometry efforts met the ATS/ERS criteria for back-extrapolation, expiratory time and end-of-test flow rates. I clicked back and forth between the different spirometry efforts to make sure the right FVC and FEV1 had been selected and when I did I noticed that the position of the tidal loop was shifting left and right and that the closer it was to TLC, the lower the FVC and FEV1 were and vice versa.

fvl_tvl_1

Continue reading

The FVC/DLCO ratio. Will the real percent predicted please stand up?

Recently a reader asked me a question about the FVC/DLCO ratio. To be honest I’d never heard of this ratio before which got me intrigued so I spent some time researching it. What I found leaves me concerned that a lack of understanding about reference equations may invalidate several dozen interrelated studies published over the last two decades.

Strictly speaking the FVC/DLCO ratio is the %predicted FVC/%predicted DLCO ratio (which is usually abbreviated FVC%/DLCO%) and it appears to be used exclusively by specialists involved in the treatment of systemic sclerosis and related disorders. Specifically, the ratio is used to determine whether or not a patient has pulmonary hypertension. The basic idea is that (quoting from a letter to the editor):

“As we know, in ILD both FVC and DLCO fall and their fall is proportionate, whereas in pulmonary arterial hypertension DLCO falls significantly and disproportionately to FVC.”

A variety of algorithms using the FVC%/DLCO% have been devised. Inclusion factors are usually an FVC < 70% of predicted and a DLCO (corrected for hemoglobin) < 60% of predicted. A number of different threshold values for FVC%/DLCO% have been published ranging from 1.4 to 2.2 with the differences appearing to be dependent on study population characteristics and the type of statistical analysis performed. It is thought that individuals meeting the inclusion factors with an FVC%/DLCO% ratio above the threshold most probably have pulmonary hypertension.

Continue reading

When no change is a change, or is it?

I was reviewing a spirometry report last week and when I went to compare the results with the patient’s last visit I noticed that the FVC and FEV1 hadn’t changed significantly. However, the previous results were from 2009 and when the percent predicted is considered there may have been a significant improvement.

2009 Observed: %Predicted:
FVC: 2.58 87%
FEV1: 1.60 72%
FEV1/FVC: 62 82%
2016 Observed: %Predicted:
FVC: 2.82 104%
FEV1: 1.65 82%
FEV1/FVC: 59 79%

The answer to whether or not there was an improvement would appear to depend on what changes you’d normally expect to see in the FVC and FEV1 over a time span of 7 years. The FVC and FEV1 normally peaks around age 20 to 25 and then declines thereafter.

fvc_predicted_l

fev1_predicted_l

[more] Continue reading

Top 10 spirometry errors and mistakes

A couple of days ago my medical director and I had a short discussion about teaching pulmonary fellows to read PFTs and agreed that in order to be good at interpreting PFTs it isn’t the basic algorithms that are hard, it’s gaining an understanding of test quality and testing problems. My medical director then suggested this topic. At first I wasn’t sure I could find 10 errors but after spending a couple hours digging through my teaching files I managed to come up with just a few more than that. So strictly speaking it’s not a top 10 list but I kept the title because I liked it.

Spirometry errors and mistakes seem to fall into four categories: demographics, reference equations, testing and interpretation.

Demographics:

Normal values are based on an individual’s age, height and gender. When this information is entered incorrectly the normal reference values will also be incorrect. These errors often go uncaught because whoever reviews and interprets reports usually isn’t the same person who sees the patient and performs the tests. This type of error often doesn’t get corrected until the results are uploaded into a hospital information system or the patient returns for a second (or third or fourth) visit.

1. Wrong gender.

Pulmonary function reference equations are gender specific and for individuals with the same age and height, men will have a larger FVC and FEV1 than women do. When a patient’s demographics information is manually entered into a PFT system it’s always possible for somebody to enter the wrong gender. When this happens the predicted values will be either over- or under-estimated. This happens in my lab at least a half a dozen times a year and it’s why when I review reports I try to check the patient’s gender right after reading their name.

This is also a problem area for individuals who have gone through gender reassignment (transsexuals). An individual’s physiologic/developmental gender needs to be used to generate predicted values but this may be at odds with their gender recorded in a hospital’s information system. Some PFT lab systems populate their demographics information from their hospital’s information system when an order is received and it may or may not be possible to alter gender once this has happened. In other cases, an individual’s demographics may be cross-referenced when PFT results are uploaded into hospital information system and may throw an error if the wrong gender is present.

2. Wrong height

All lung volumes and capacities scale with height. Like any other manual entry height can be mis-entered and the most common error I’ve seen is for somebody to enter 60 inches when they meant 6 feet 0 inches.

Height can also be mis-measured if the patient isn’t asked to remove their shoes or to stand straight, or if the patient is asked for their height and it isn’t even measured. An error of an inch or two probably won’t make a big difference in a patient’s predicted values (particularly given the discrepancies between different reference equations) but for somebody who’s on the edge of normal and abnormal it can make a significant difference in how a report is interpreted.

Continue reading

Six-Minute Walk with Helium-Oxygen

We recently performed a 6-minute walk test with helium-oxygen (heliox) for a patient of one of the physicians that specializes in airway stenting. His reasons for the test weren’t particularly clear (and he hasn’t bothered to try to clarify them with me) but most probably it has to do with differentiating between central and peripheral airway obstruction. Interestingly, he predicted the patient would have a significant improvement in 6-minute walk distance and instead there was little difference between the heliox 6MWT and one performed with 3 LPM supplemental O2.

6MWT: SaO2: Distance:
80% Helium – 20% O2, by mask 95% 440 meters
3 LPM O2, by nasal cannula 98% 457 meters

Helium is an inert, insoluble, low mass gas and both its therapeutic use and its use in physiological measurements has to do with it’s low density (and the fact that it’s highly insoluble, but that’s for purposes different than those discussed here).

  Density (g/m3)
He 0.179
N2 1.251
O2 1.429
Air (78% N2, 21% O2) 1.293
Heliox (80% He, 20% O2) 0.429

A typical way to assess its effect is by comparing air and heliox flow-volume loops:

heo2_fvl

Interestingly, despite an apparent increase in flow rates there is usually no significant difference in FEV1 (one study showed a range of +2% to +7% in a group of over 1500 subjects). The most common heliox FVL measurements are the change in expiratory flow at 50% of the FVC (ΔMEF@50%) and the Volume of Isoflow (which is the point at which the air and heliox expiratory flows become equivalent). Many of the earlier studies with heliox also measured ∆MEF@75% and ∆FEF25-75, and a tiny handful of studies (particularly given the technical difficulties) have measured ∆RAW and ∆sGAW.
Continue reading

When flow-volume loops get kinky

One of the more recognizable flow-volume loop contours is the one associated with severe airway obstruction. Specifically, this type of loop shows an abrupt decrease in flow rate following the peak flow with a more gradual decrease in flow rates during the remainder of the exhalation.

V_Sev_OVD_03_Cropped

This abrupt decrease in flow rates was first described on a volume-time curve and the inflection point was called a “kink” but this point also corresponds with the inflection point on the flow-volume loop. This feature has also been called a “notch” or a “spike” but a number of researchers have called this the Airway Collapse pattern (AC) and it is more formally defined as a sharp decrease in flow rate from peak flow to a discontinuity point at less than 50% of the peak flow and occurring within the first 25% of the exhaled vital capacity.

Continue reading

Selecting the best FEV1. What role should PEF play?

Recently my lab has had some turnover with a couple of older staff leaving and new staff coming on board. While reviewing reports I’ve found a number of instances where the incorrect FVC and FEV1 were reported. Taking these as “teachable moments” I’ve been annoying the staff with emails whenever I find something notably wrong. I had thought that our rules for selecting the best FVC and FEV1 were fairly straightforward but given the number of corrections I’ve made lately it seemed like it would be a good idea to revisit our policy on this subject.

The process I’ve used for selecting the best FVC and FEV1 has evolved over the years. Initially I was told to select the single spirometry effort that had the largest combined FVC and FEV1. Later on test quality became a factor (not that is wasn’t in the beginning but there aren’t a lot of quality indicators for a pen trace on kymograph paper). How to juggle the different quality rules wasn’t altogether clear however (they seemed to change a bit with whichever physician was reviewing PFTs at the time), and I was still supposed to somehow select just a single spirometry effort.

Most recently this was simplified by only having to select the largest FVC (regardless of test quality) from any spirometry effort and then the largest FEV1 as long as it came from a spirometry effort with good quality. This is pretty much in accord with the ATS/ERS spirometry standards but with one important difference, and that is that we use use Peak Expiratory Flow (PEF) as an indicator of test quality.

Strictly speaking the ATS/ERS standards state that

“The largest FVC and the largest FEV1 (BTPS) should be recorded after examining the data from all of the usable curves, even if they do not come from the same curve.”

There are, of course, a number of quality indicators for spirometry efforts that are used to indicate whether a curve is “usable”. These include things like back-extrapolation, expiratory time, terminal expiratory flow rate and repeatability but the one thing they do not include is PEF.

Despite not being within the ATS/ERS standards the reason that we use PEF in the selection process is found in the phrase “maximal forced effort” that is part of the ATS/ERS definition for FVC and FEV1. It has long been recognized (certainly since the early 1980’s and most likely earlier) that the FVC and FEV1 from a submaximal spirometry effort were often higher than the FVC and FEV1 from a maximal effort. So, is the largest FEV1 correct (as long as it meets the basic ATS/ERS criteria) or should it be the FEV1 from the effort with the highest PEF?

These two efforts from the same patient testing session highlight this dilemma. Both meet the ATS/ERS criteria for the start of the test which is what primarily applies to FEV1 (and PEF).

FEV1_vs_PEF_FVL

FEV1_vs_PEF_V-T

Blue: Red:
FVC (L): 2.72 3.06
FEV1 (L): 1.73 1.99
PEF (L/sec): 6.28 3.82

Continue reading

COPD and the FEV1/FVC ratio. GOLD or LLN?

Everyone uses the FEV1/FVC ratio as the primary factor in determining the presence or absence of airway obstruction but there are differences of opinion about what value of FEV1/FVC should be used for this purpose. Currently there are two main schools of thought; those that advocate the use the GOLD fixed 70% ratio and those that instead advocate the use the lower limit of normal (LLN) for the FEV1/FVC ratio.

The Global Initiative for Chronic Obstructive Lung Disease (GOLD) has stated that a post-bronchodilator FEV1/FVC ratio less than 70% should be used to indicate the presence of airway obstruction and this is applied to individuals of all ages, genders, heights and ethnicities. The official GOLD protocol was first released in the early 2000’s and was initially (although not currently) seconded by both the ATS and ERS. The choice of 70% is partly happenstance since it was one of two fixed FEV1/FVC ratio thresholds in common use at the time (the other was 75%) and partly arbitrary (after all why not 69% or 71% or ??).

The limitations of using a fixed 70% ratio were recognized relatively early. In particular it has long been noted that the FEV1/FVC ratio declines normally with increasing age and is also inversely proportional to height. For these reasons the 70% threshold tends to over-diagnose COPD in the tall and elderly and under-diagnose airway obstruction in the short and young. Opponents of the GOLD protocol say that the age-adjusted (and sometimes height-adjusted) LLN for the FEV1/FVC ratio overcomes these obstacles.

Proponents of the GOLD protocol acknowledge the limitation of the 70% ratio when it is applied to individuals of different ages but state that the use of a simple ratio that is easy to remember means that more individuals are assessed for COPD than would be otherwise. They point to other physiological threshold values (such as for blood pressure or blood sugar levels) that are also understood to have limitations, yet remain in widespread use. They also state that it makes it easier to compare results and prevalence statistics from different studies. In addition at least two studies have shown that there is a higher mortality of all individuals with an FEV1/FVC ratio below 70% regardless of whether or not they were below the FEV1/FVC LLN. Another study noted that in a large study population individuals with an FEV1/FVC ratio below 70% but above the LLN had a greater degree of emphysema and more gas trapping (as measured by CT scan), and more follow-up exacerbations than those below the LLN but above the 70% threshold.

Since many of the LLN versus GOLD arguments are based on statistics it would be useful to look at the predicted FEV1/FVC ratios in order to get a sense of how much under- and over-estimation occurs with the 70% ratio. For this reason I graphed the predicted FEV1/FVC ratio from 54 different reference equations for both genders and a variety of ethnicities. Since a number of PFT textbooks have stated that the FEV1/FVC ratio is relatively well preserved across different populations what I initially expected to see was a clustering of the predicted values. What I saw instead was an exceptionally broad spread of values.

Male_175cm_Predicted

[more] Continue reading

Ventilatory Challenge Testing

Airway hyper-responsiveness is a primary feature of asthma. There are a number of bronchial challenge tests designed to evoke and measure this factor, the most common of which require the inhalation of one or another bronchoconstrictive agent such as methacholine, histamine, mannitol or hypertonic saline.

An elevated ventilation can cause many asthmatics to bronchoconstrict and this is often the cause of Exercise-Induced Bronchospasm (EIB). There are two competing theories as to why this happens. A number of researchers have suggested that the mechanism is a drying of the airway mucosa which changes the osmolarity of the respiratory tract fluid which in turn causes some cells to releases mediators that cause bronchoconstriction. Other researchers assert that it is the cooling of the airways during hyperventilation and an increased blood flow and edema during subsequent re-warming that causes the bronchoconstriction. There is evidence to support both interpretations and it is likely that both mechanisms coexist, with one or the other being more predominant in any given individual.

Although the inhalation challenge tests are reasonably sensitive not all patients with EIB have a positive reaction. When a patient’s primary complaint is exercise-related or when they have had a negative inhalation challenge test and are still symptomatic, a ventilatory challenge test should be considered. There are several ventilatory challenge tests that are specifically oriented towards evoking and characterizing EIB. These are the Cold Air challenge, Eucapnic Voluntary Hyperventilation and Exercise Challenge. There are a number of similarities between these tests.

Cold Air Challenge

A Cold Air Challenge (CACh) test consists of having a patient hyperventilate while breathing air that has been cooled to a temperature of between -10°C and -20°C. It is usually performed using a mixture of 5% CO2, 21% O2, 74% N2 in order to prevent dizziness from hypocapnia.

Continue reading